• Faster discovery cycles, with measurable time savings.
• Design insights shared across teams using engineering-native tools (GitHub, Cursor).
• Stakeholders proactively seeking research input from customer conversations, feeding directly into our innovation stream.
From “Can we build it?” to “Should we build it?” — demonstrating that, in the age of AI, knowing what to build is design’s strategic value.
Early concepts validated and prioritised through Jobs‑To‑Be‑Done and Outcome‑Driven Innovation. We focus on confidence, clarity, and decision‑making over feature volume.

Payroll professionals care deeply about employees and value solutions that reduce cognitive load — a core insight that reshaped our discovery focus.
• Externally: Customers were asking for less friction and more confidence — not more features.
With AI enabling us to build faster than ever, the question shifted from "Can we build it?" to "What should we build that adds value?"
• Fragmenting effort across teams
• Adding complexity to already overloaded users
Replace idea-led planning with opportunity-led discovery. Know what to build, why, and in what order – backed by customer evidence, not internal assumptions.

Payroll Professionals work under intense, deadline‑driven pressure. Our JTBD work highlighted consistent stress points during pay periods and clarified where our product should actively guide users and reduce cognitive load.
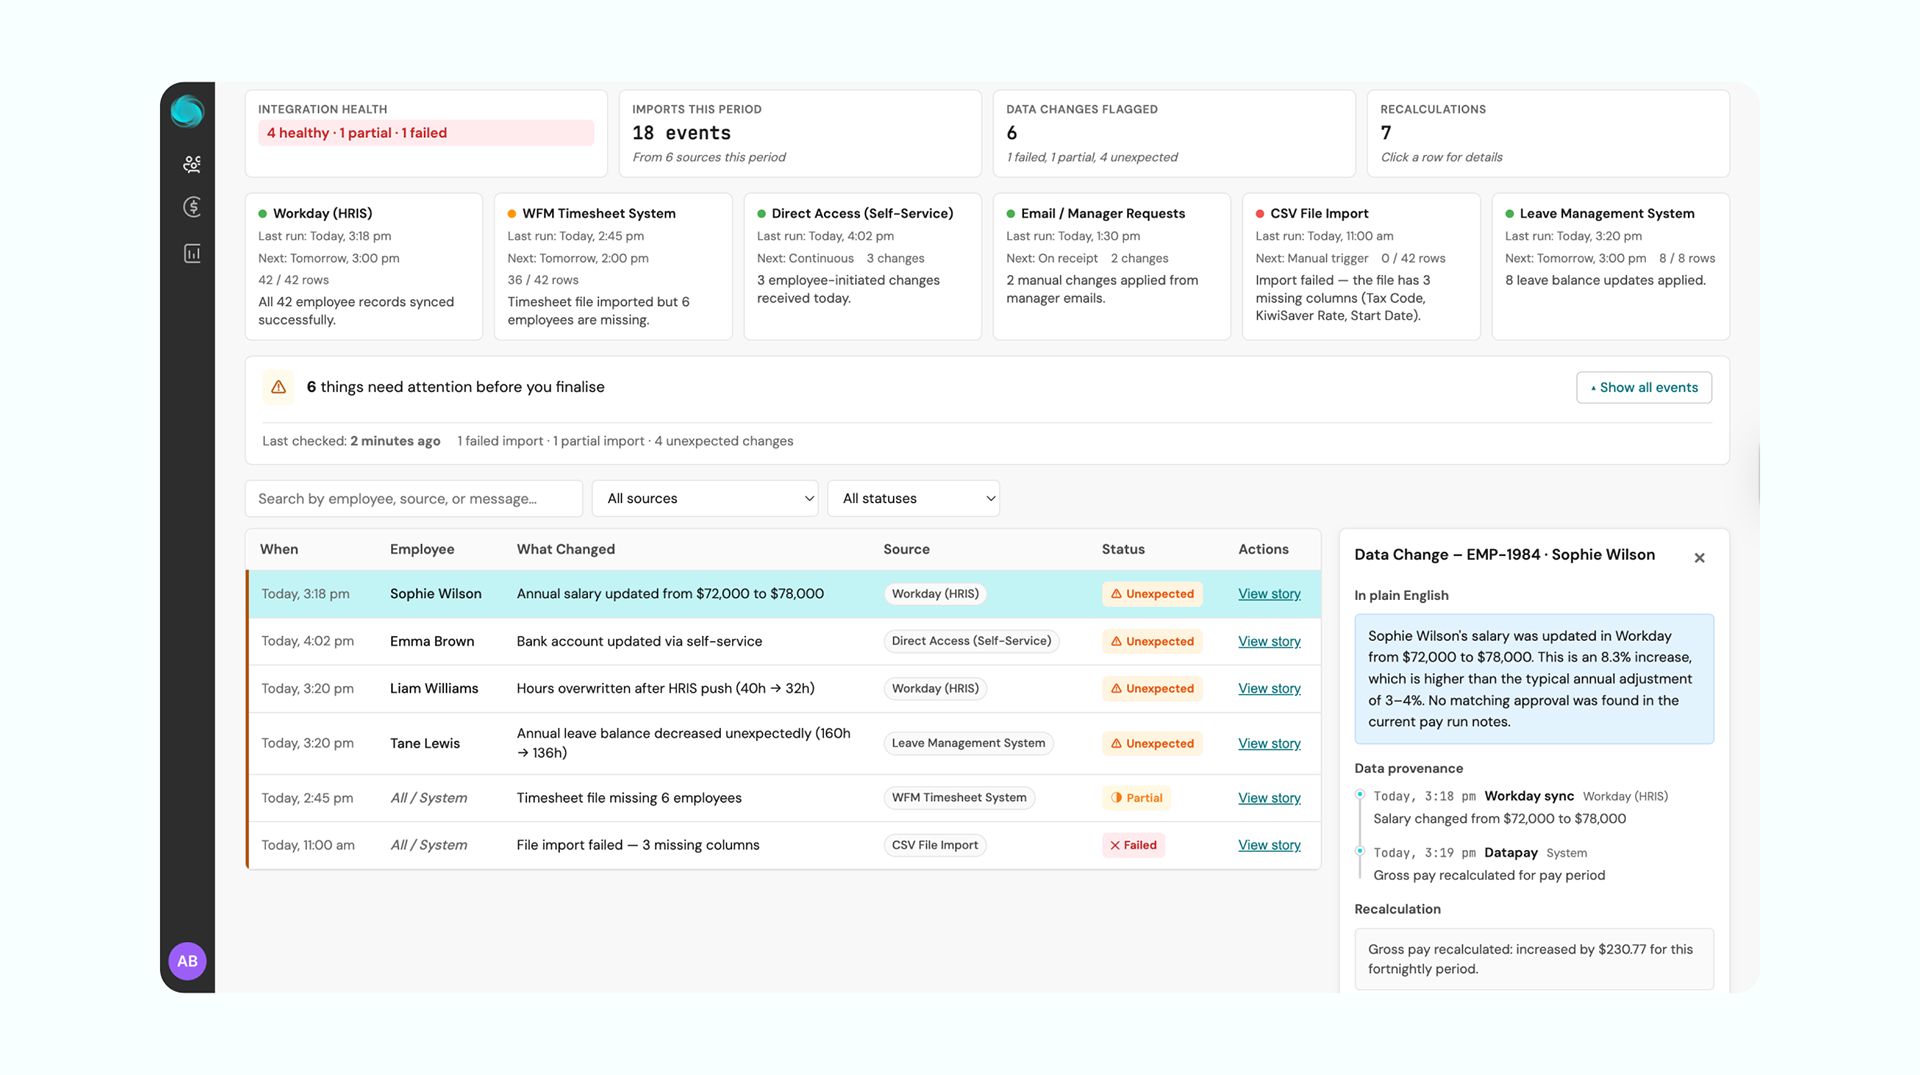
Payroll Professional JTBD — Monitor (Job Stage 6.3): Monitoring data and integrations to ensure payroll confidence, accuracy, and continuity.
• Led Jobs‑To‑Be‑Done and Outcome‑Driven Innovation (opportunity scoring), synthesising insights from 21 research studies and 18 stakeholders into clear artefacts that guide discovery and roadmap decisions.
Product Leadership, Customers, Design, Engineering, Data, Compliance, Customer Success, and Go‑to‑Market.
Conversations with internal teams informed our understanding of what Datapay already does well — and where payroll professionals still struggle to feel confident and in control.

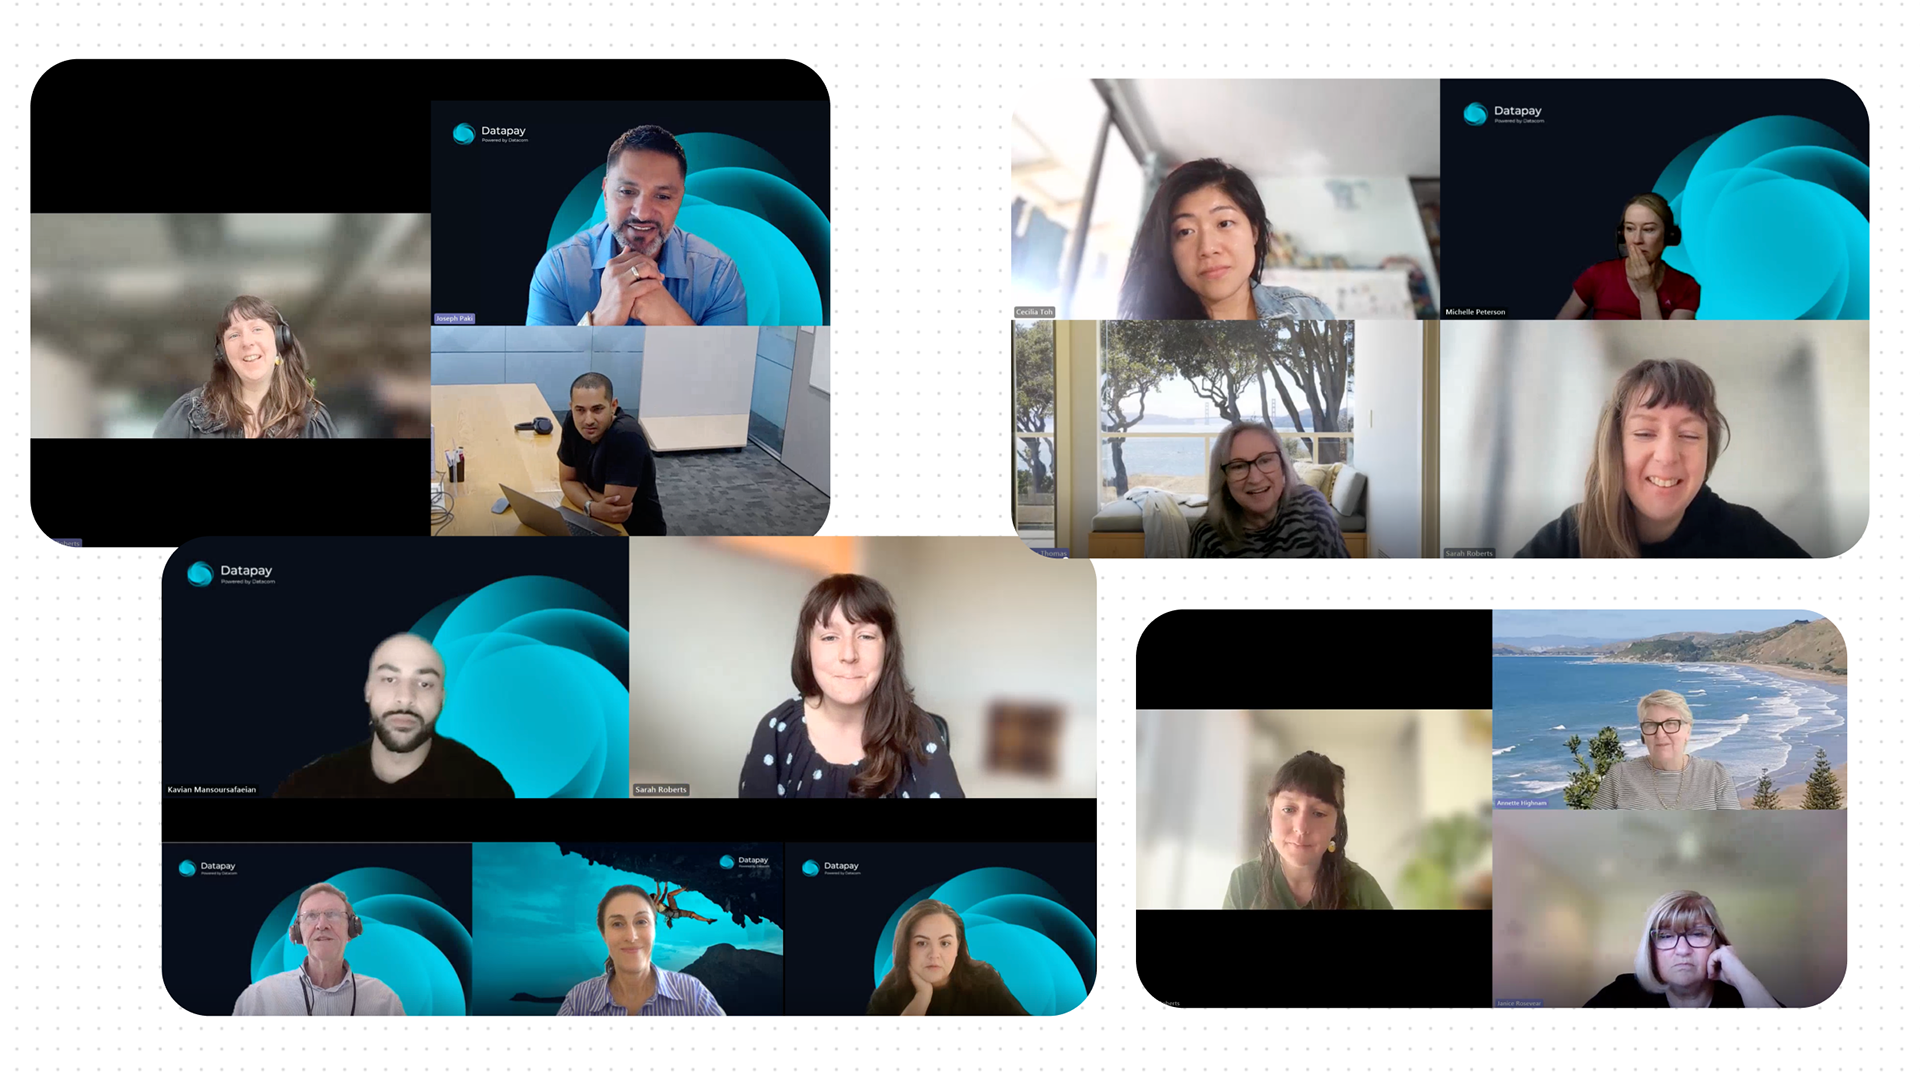
Conversations with our existing customers are a favourite part of my role.
Part 1: Building a Customer-Centred Roadmap (JTBD & ODI)
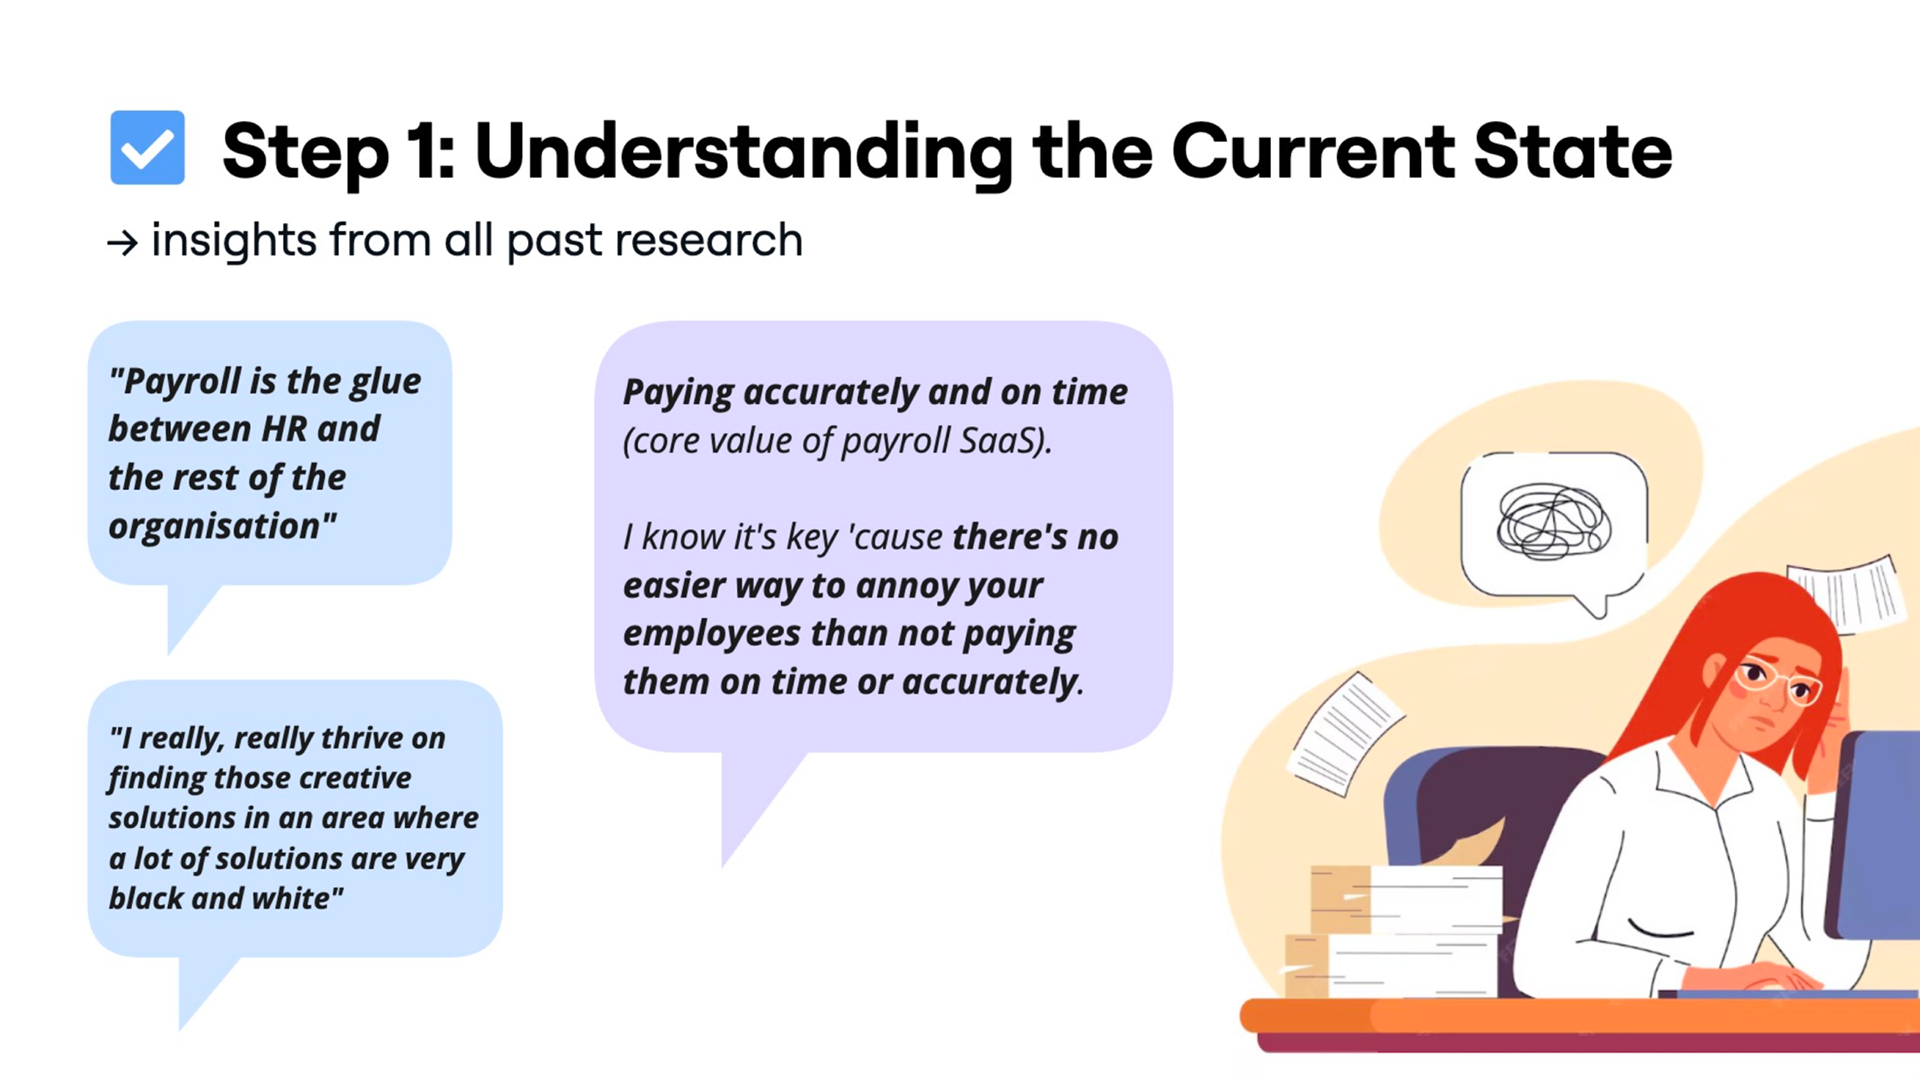
Insights synthesised from 21 past research projects (including five I led at Datapay), highlighting consistent themes around accuracy, trust, and the consequences of getting payroll wrong.
• Reporting & payroll verification (6/6 sessions)
Customers need exception‑first workflows and operational efficiency. The issue isn’t a missing feature — it’s a broken control layer.
Customers are using manual workarounds where automation should be trustworthy
Complexity increases significantly at scale, and existing flows struggle to support it.
"Reporting is how enterprise customers prove payroll is correct — when it fails, everything fails"
Our roadmap was driven by isolated requests, not recognisable patterns of unmet customer needs.
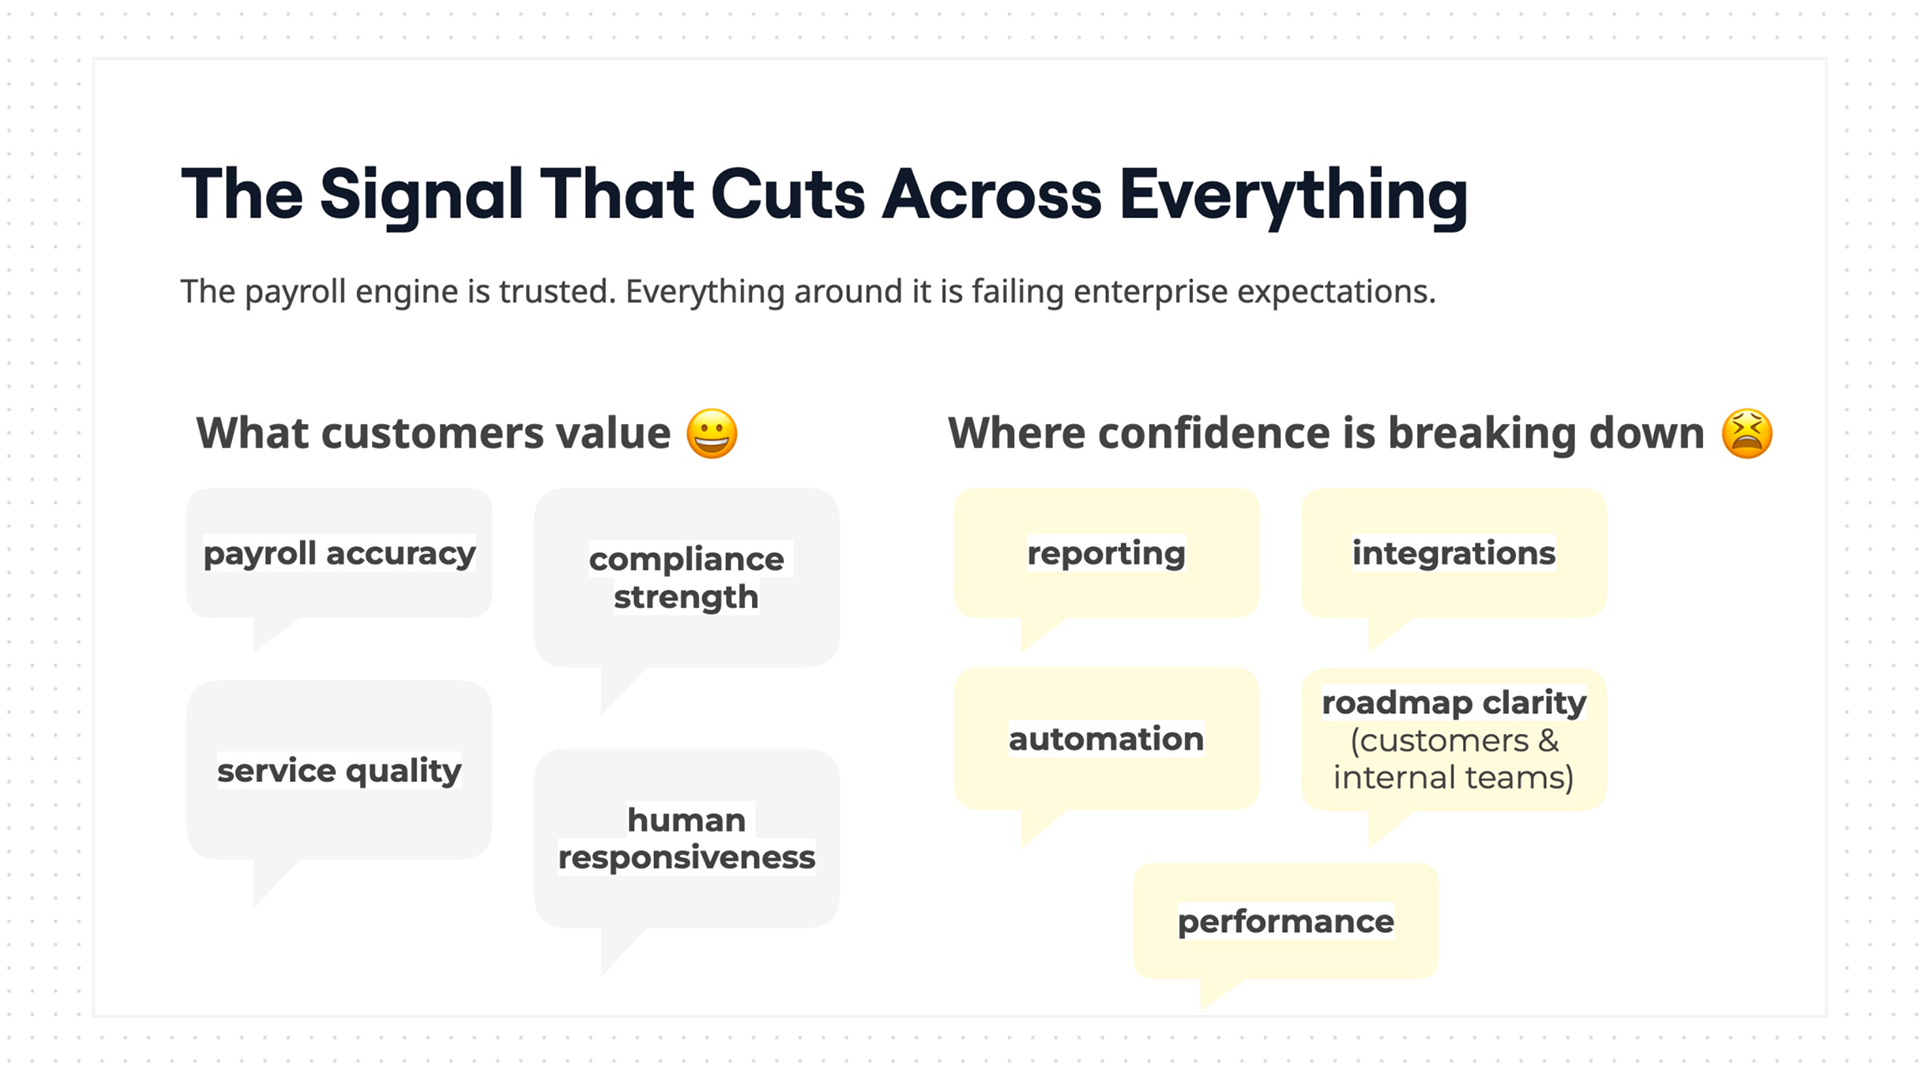
A high‑level synthesis showing what customers value most (accuracy, compliance, service quality) and where confidence consistently breaks down — particularly across reporting, integrations, and automation.
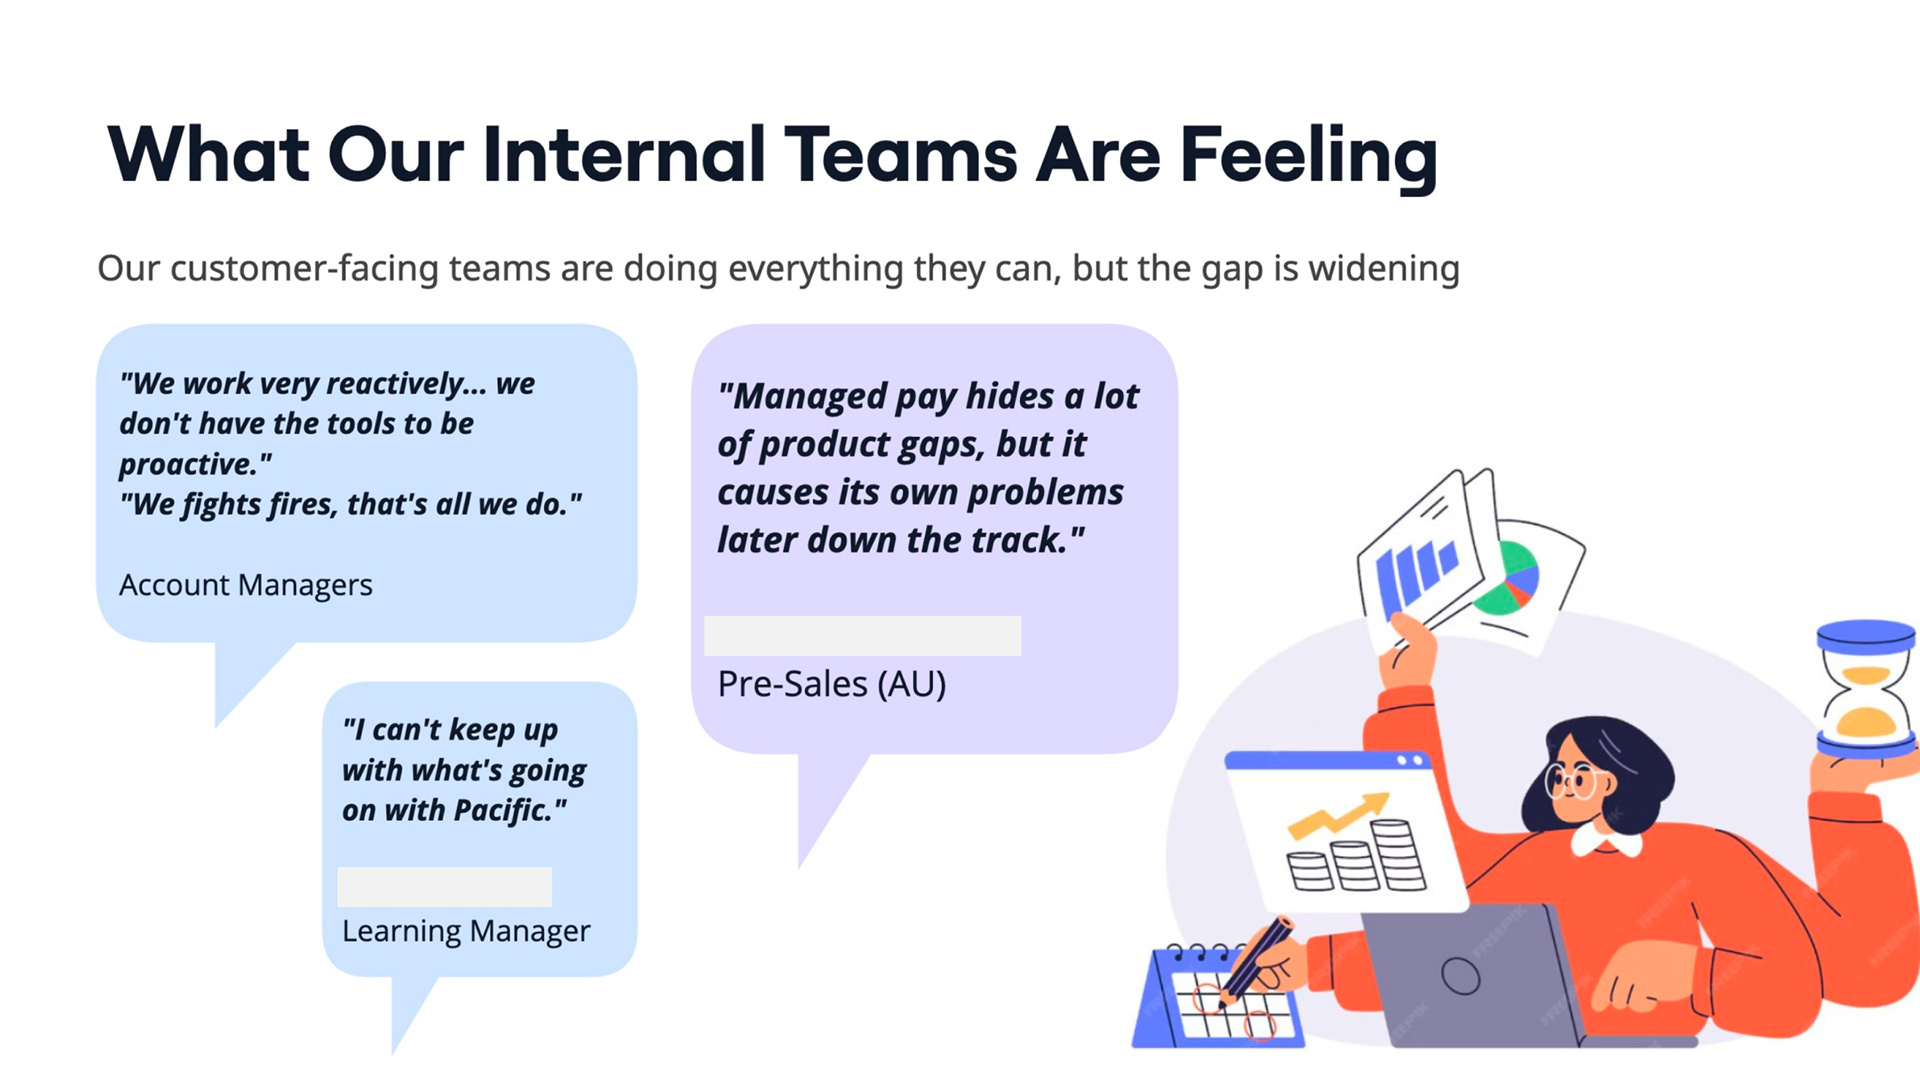
Feedback from customer‑facing teams highlights increasing pressure and reactive workflows, revealing a growing gap between customer expectations and current product behaviour — and a clear opportunity for product, design, and support to work differently.
Employees want the right amount of pay on time, every time.
Confidently approve pay-affected changes for their team without holding up the pay run.
Pay employees correctly, compliantly, and on time. Every time.
Confirm payroll is accurate, compliant, and properly controlled with evidence.
Get the payroll data I need, in a format I can use, without creating work for the Payroll Professionals and without delay.
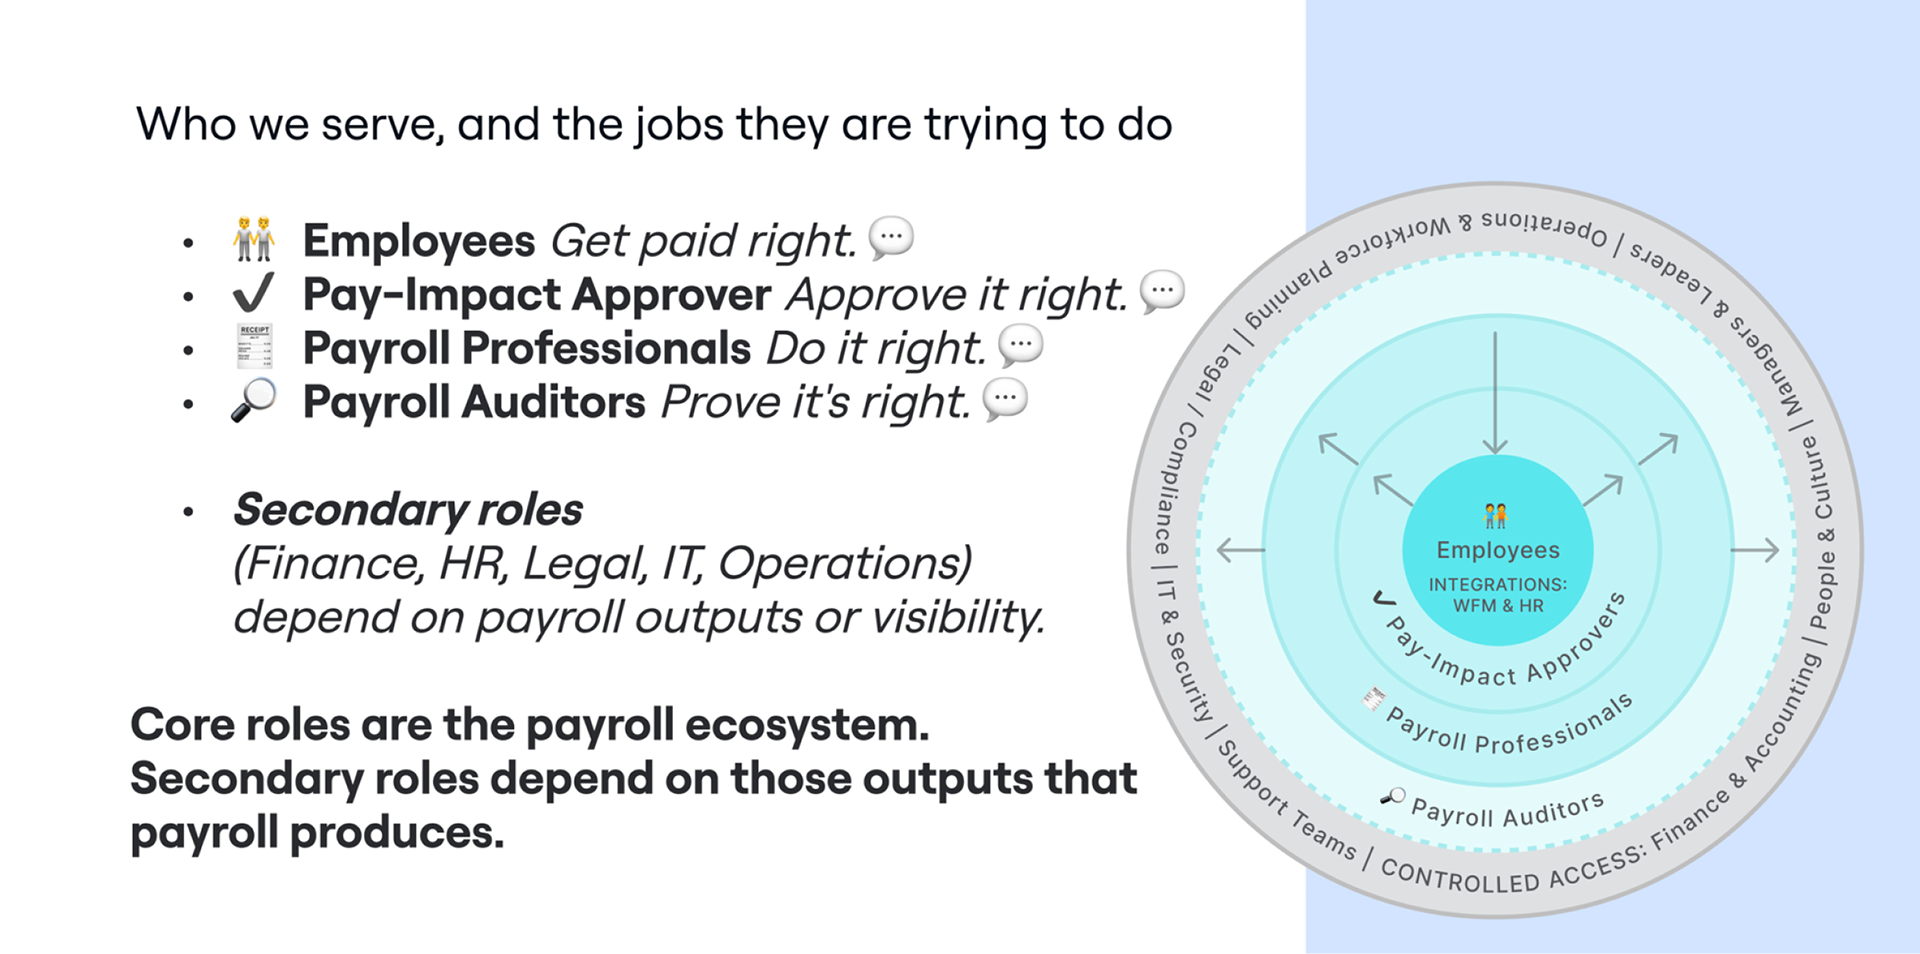
A visual representation of payroll as an interconnected system, showing how employees, approvers, payroll professionals, auditors, and secondary roles rely on controlled data flows and safeguards.

Enjoying the deep validation work with SMEs, spending hours asking “why” to refine roles, job boundaries, and dependencies — uncovering critical insights that shaped the market canvas.
For Payroll Professionals, we mapped 34 job steps across eight job stages. This surfaced 28 high‑opportunity areas — all representing unmet needs where they currently struggle to perform their core role.
• Identify issues that need attention. Confirm stage, step 4.2.
• Monitor data and integration changes during processing. Monitor stage, step 6.3.
• Monitor recurring issues or patterns across pay cycles. Monitor stage, step 6.5.
• Deliver accurate payroll outputs/reporting. Conclude stage, step 8.1.
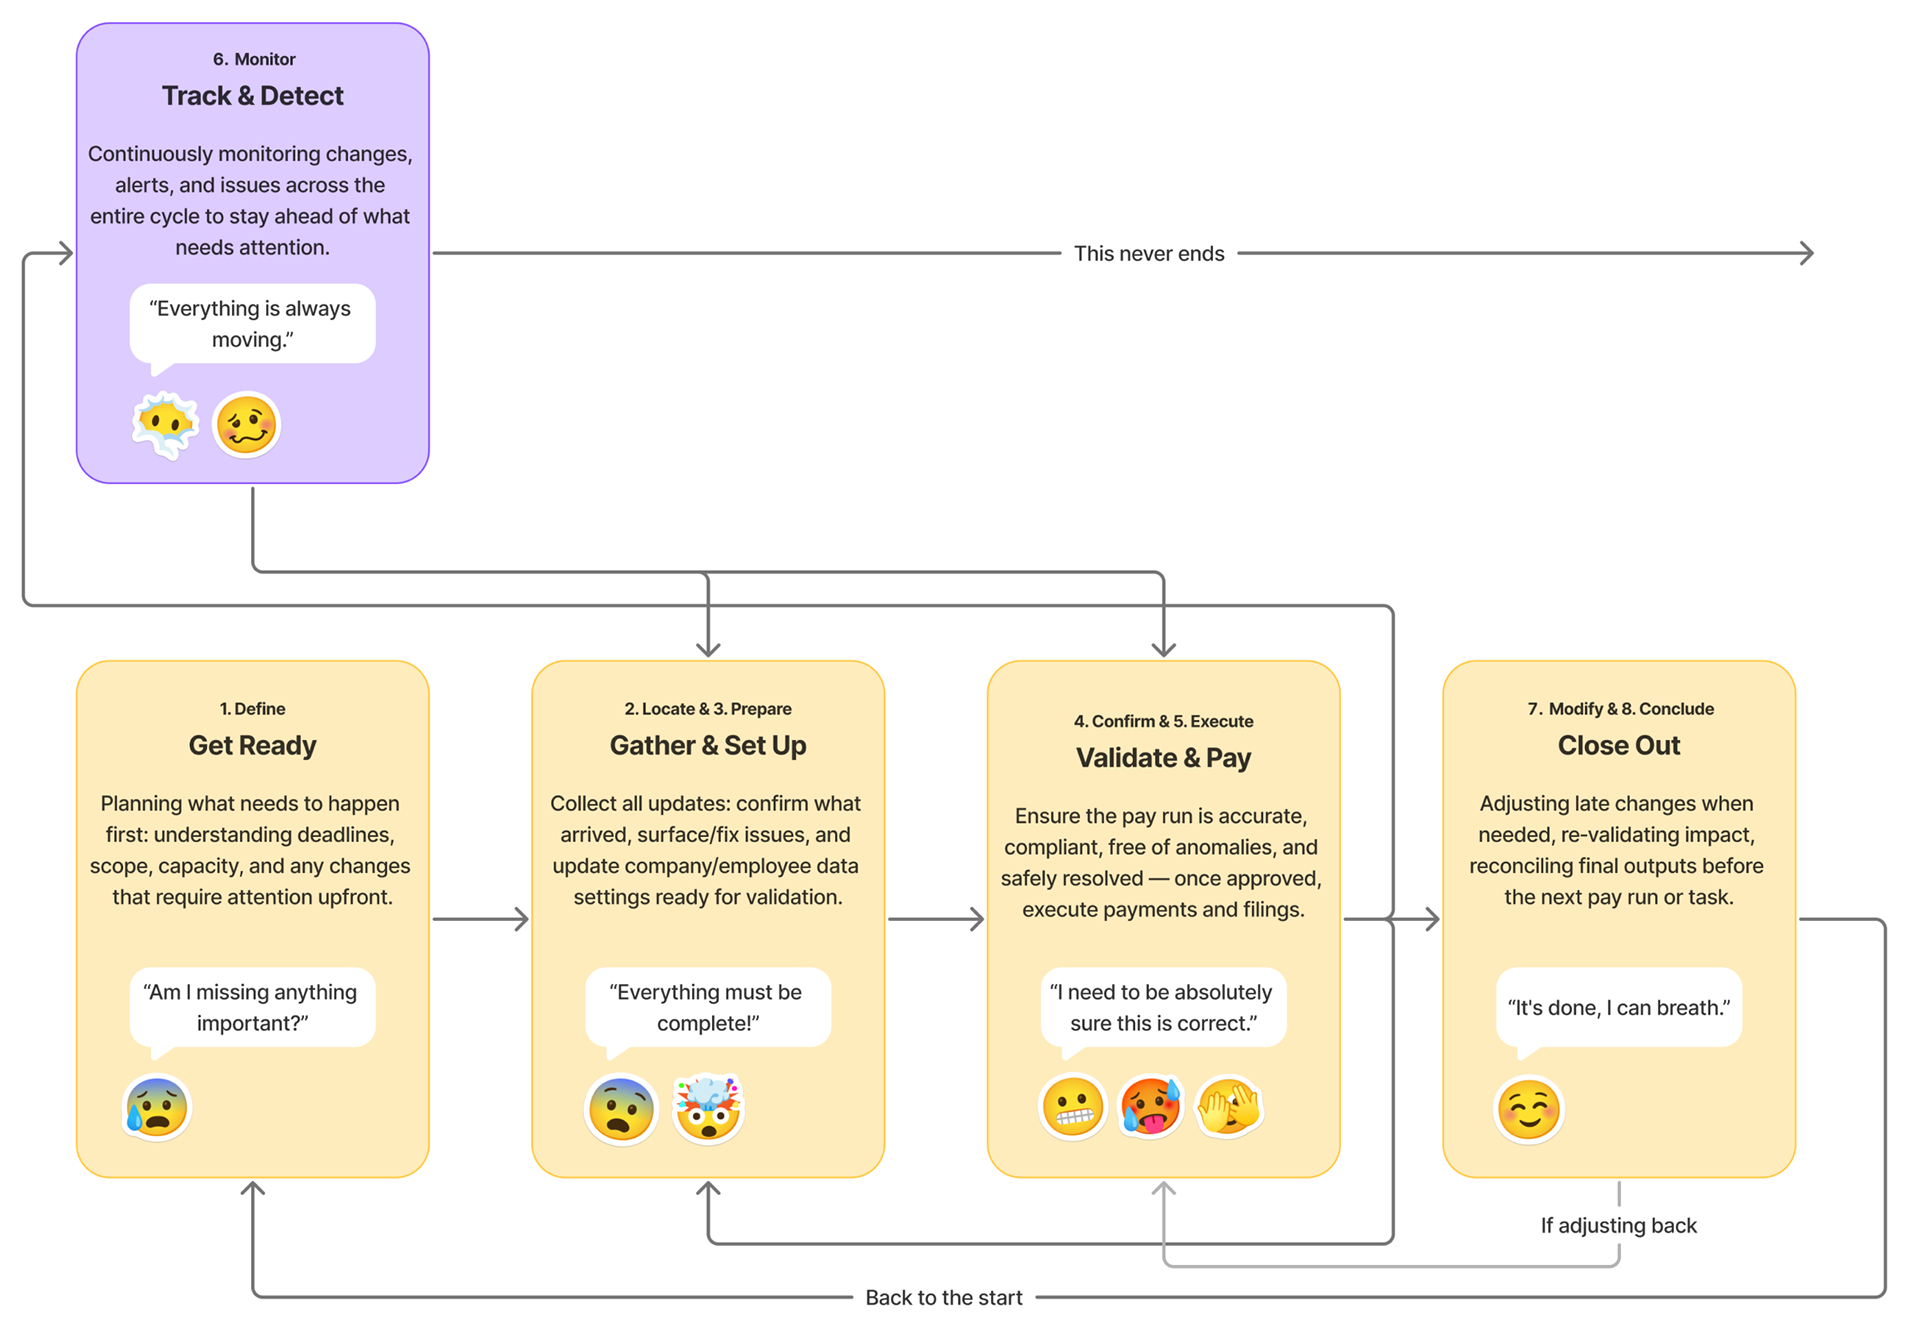
A visual representation of the full Payroll Professional job map, showing how cognitive load and risk accumulate across stages, particularly during the stages confirm, execute and monitor.
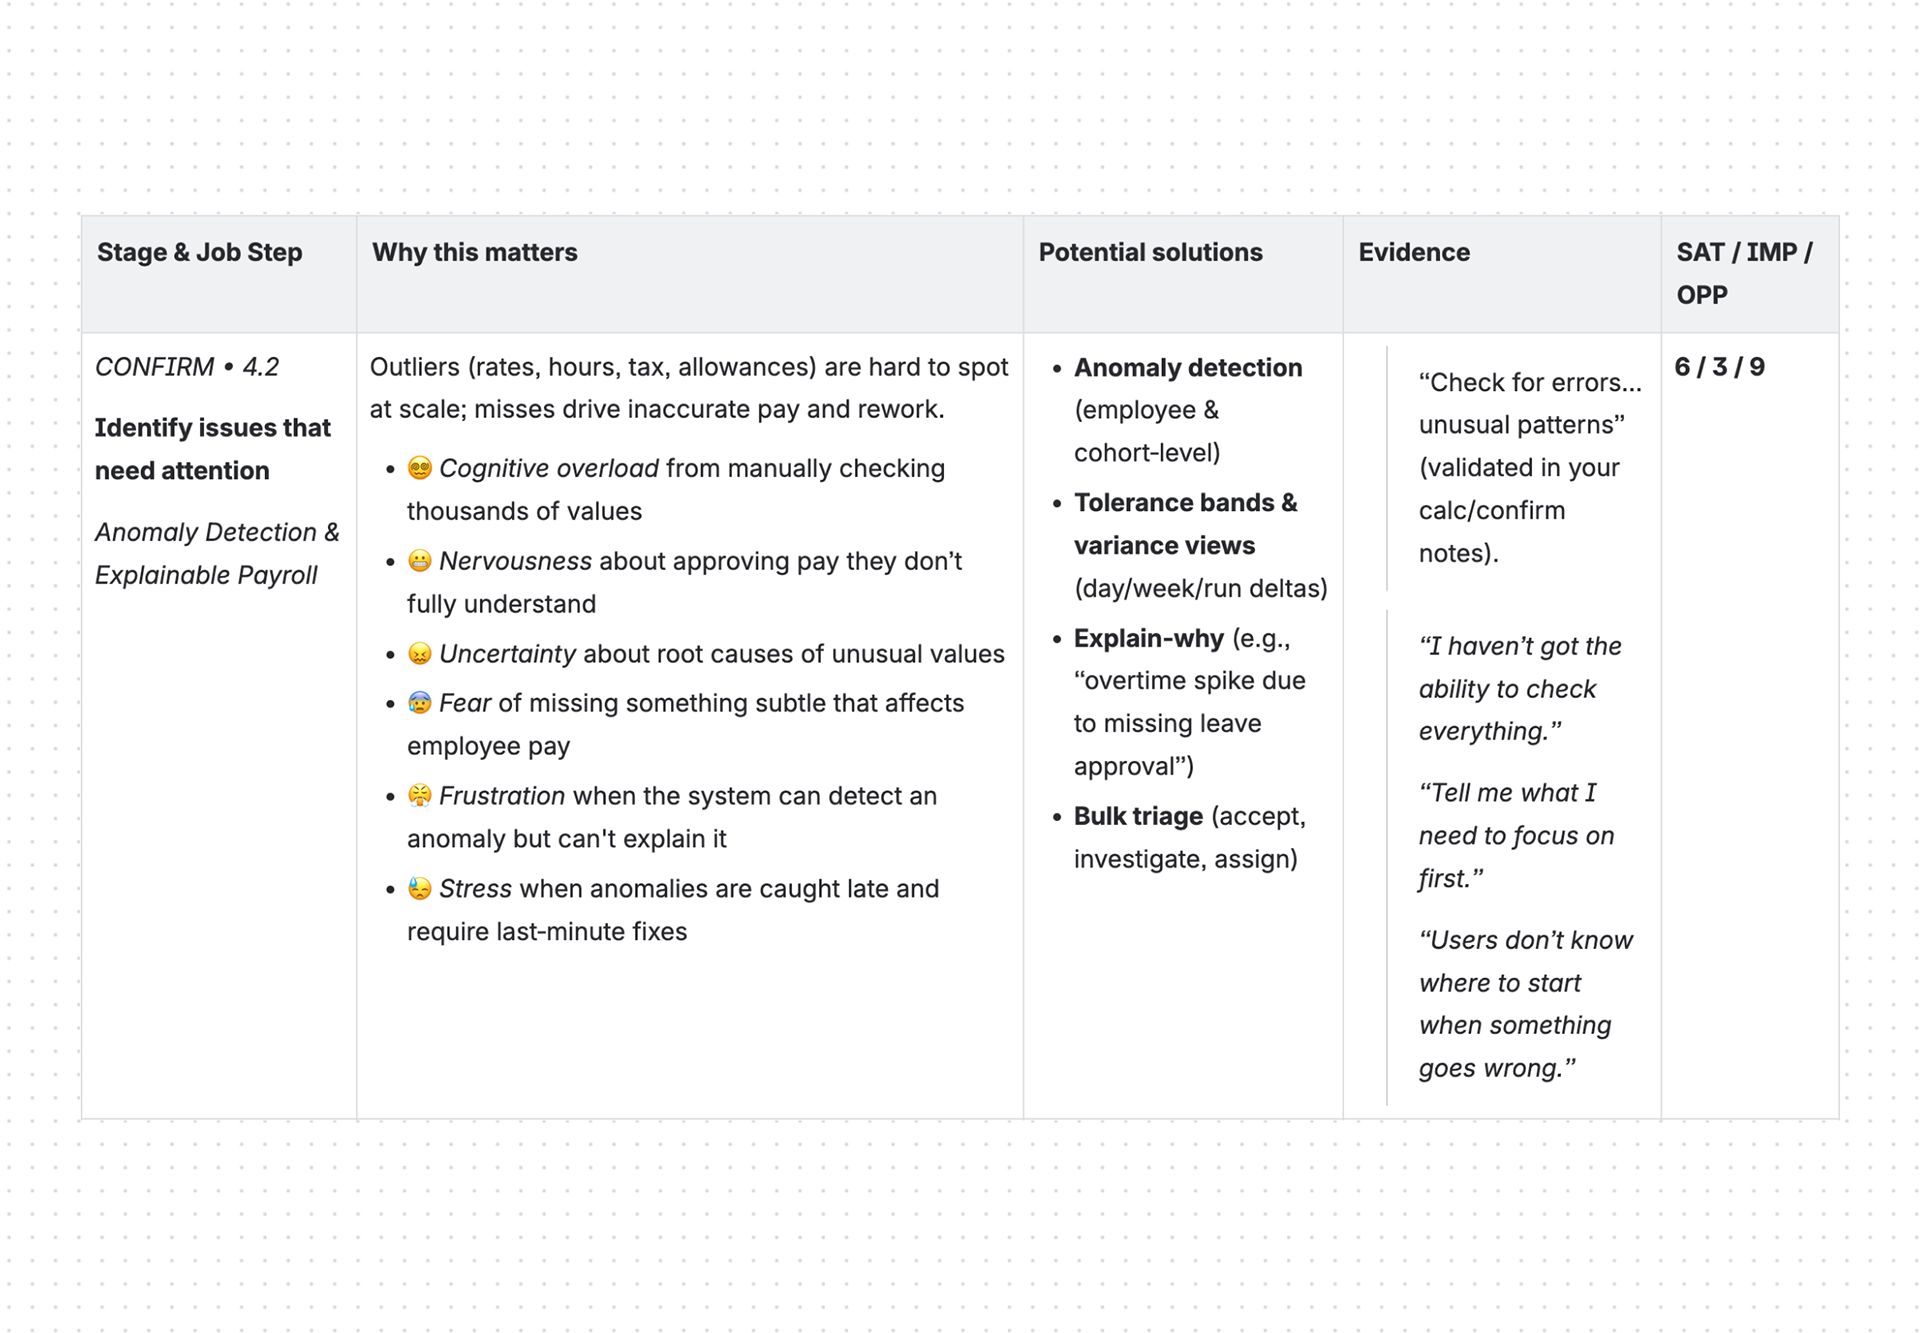
Example of Confirm 4.2: Identify issues that need attention, illustrating how ODI scoring connects unmet needs, emotional jobs, and evidence to prioritised product opportunities.
"Identify issues that need attention"
Opportunity score: Importance 6 / Satisfaction 3 / Opportunity 9
"I haven't got the time to check everything."
"Tell me what I need to focus on first."
"Users don't know where to start when something goes wrong."
😵💫 Cognitive overload from manually checking thousands of values
😬 Nervousness about approving pay they don't fully understand
😖 Uncertainty about the root causes of unusual values
😰 Fear of missing something subtle that affects employee pay
😤 Frustration when the system can detect an anomaly but can't explain it
😓 Stress when anomalies are caught late and require last-minute fixes
• Browse customer JTBD at the level of detail that suits them — from core and secondary roles, to key opportunities, to deep insights across all eight job stages. Most importantly for CS, providing feedback if they're hearing something different.
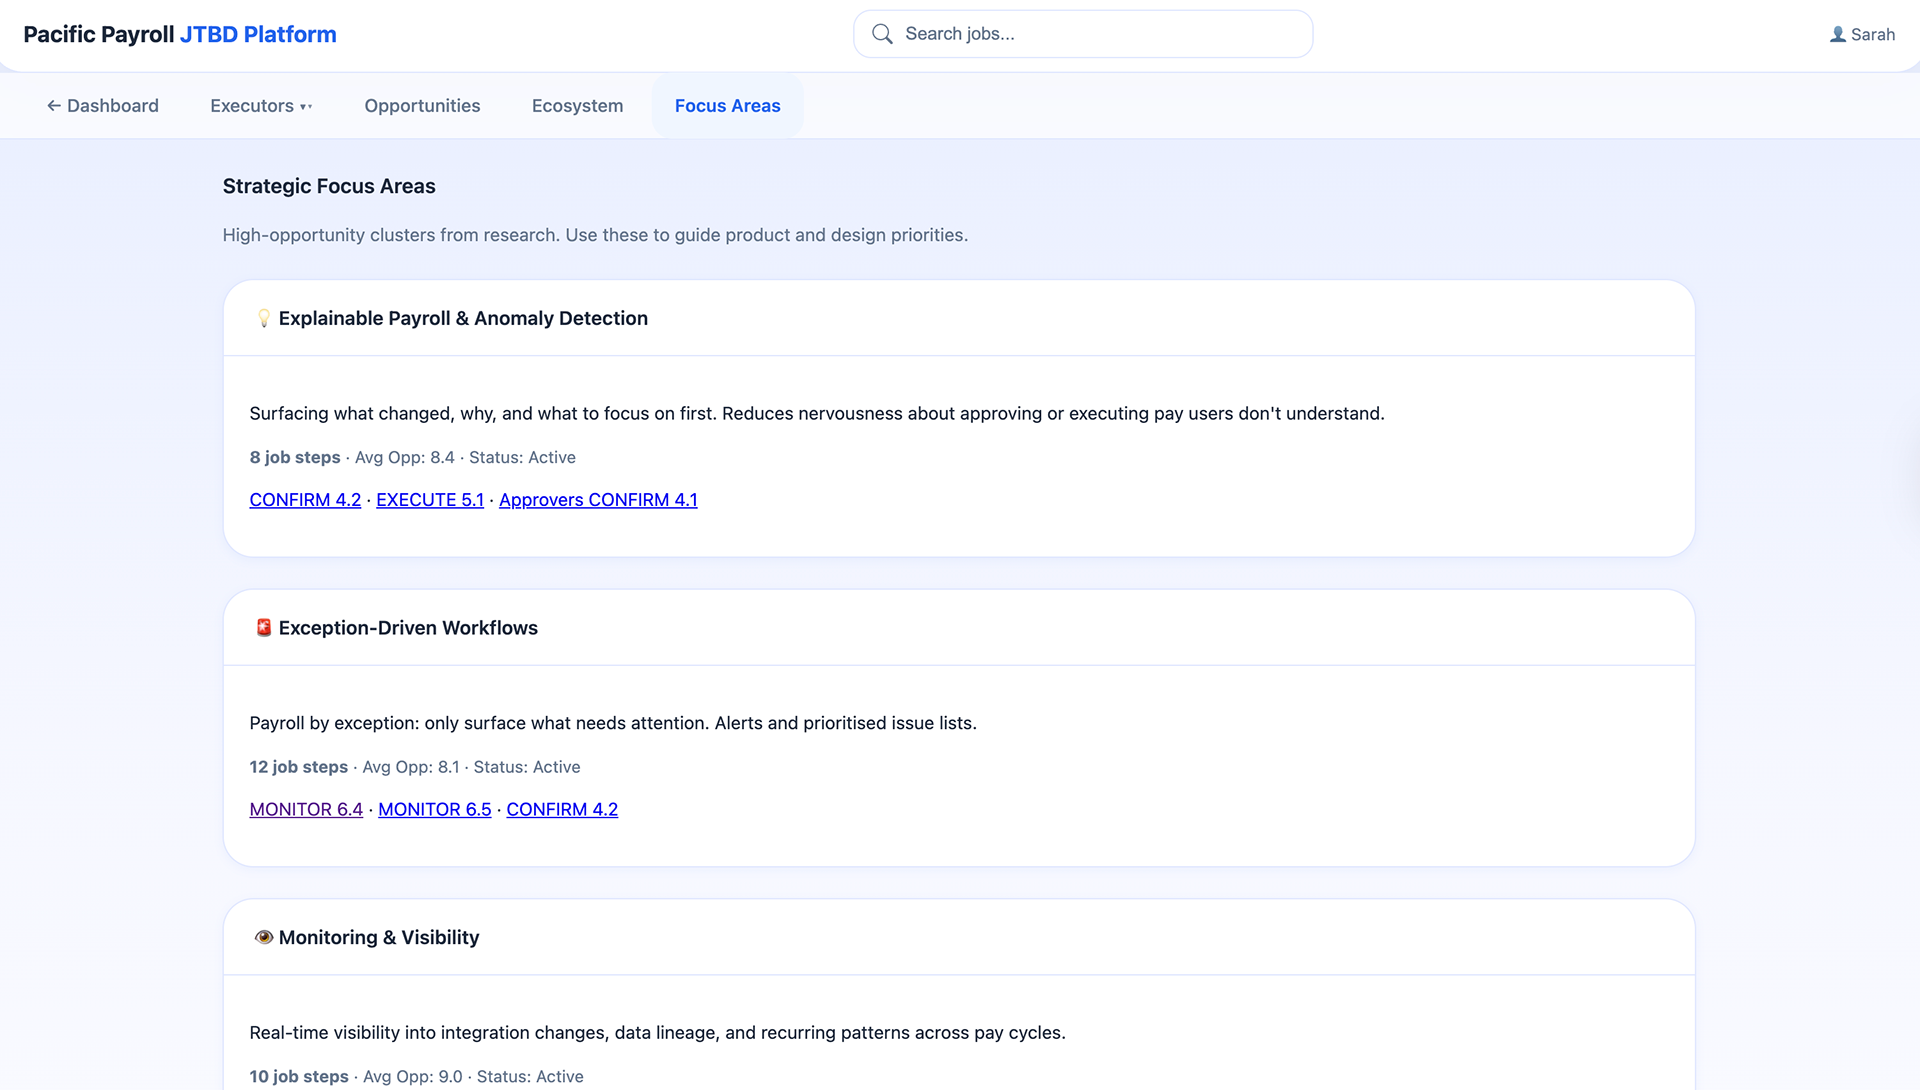
JTBD's highest strategic focus areas.
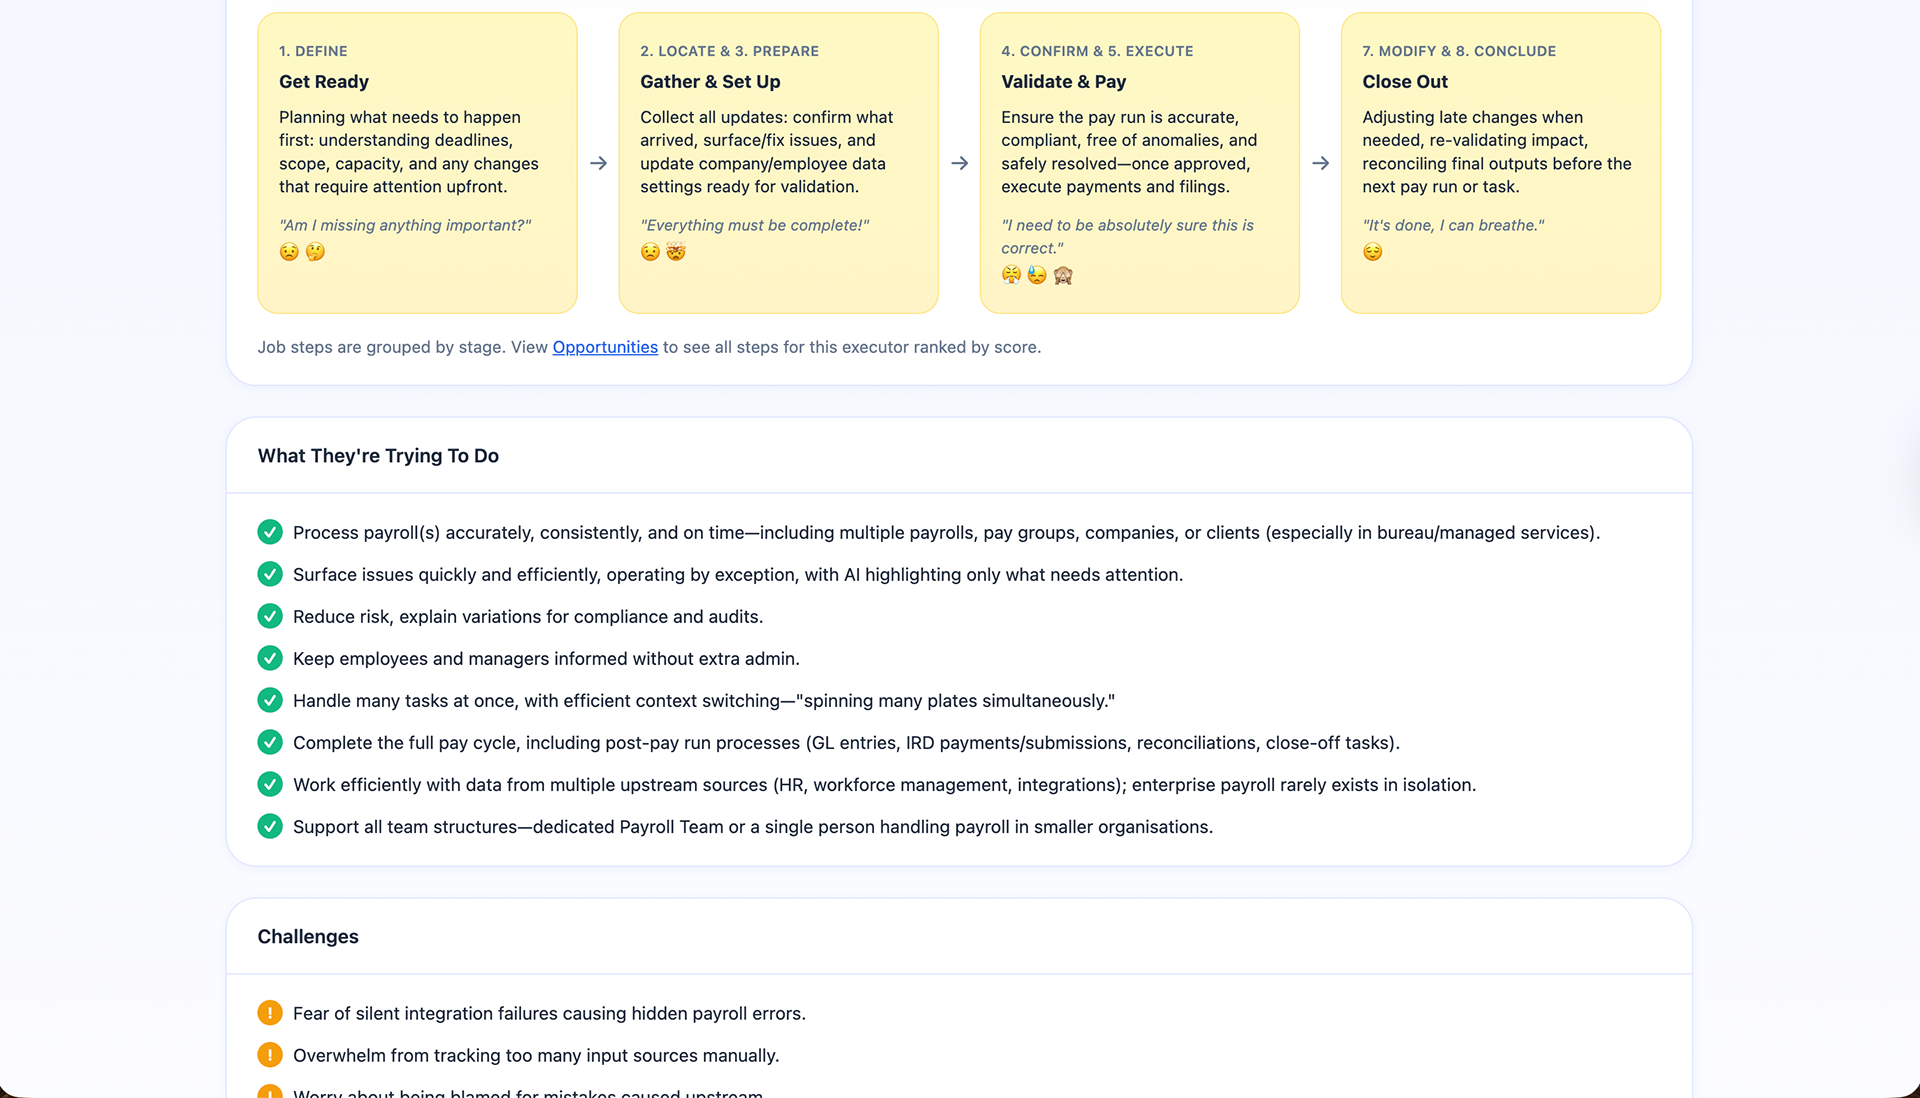
High-level overview of the Payroll Professional's Job Map.
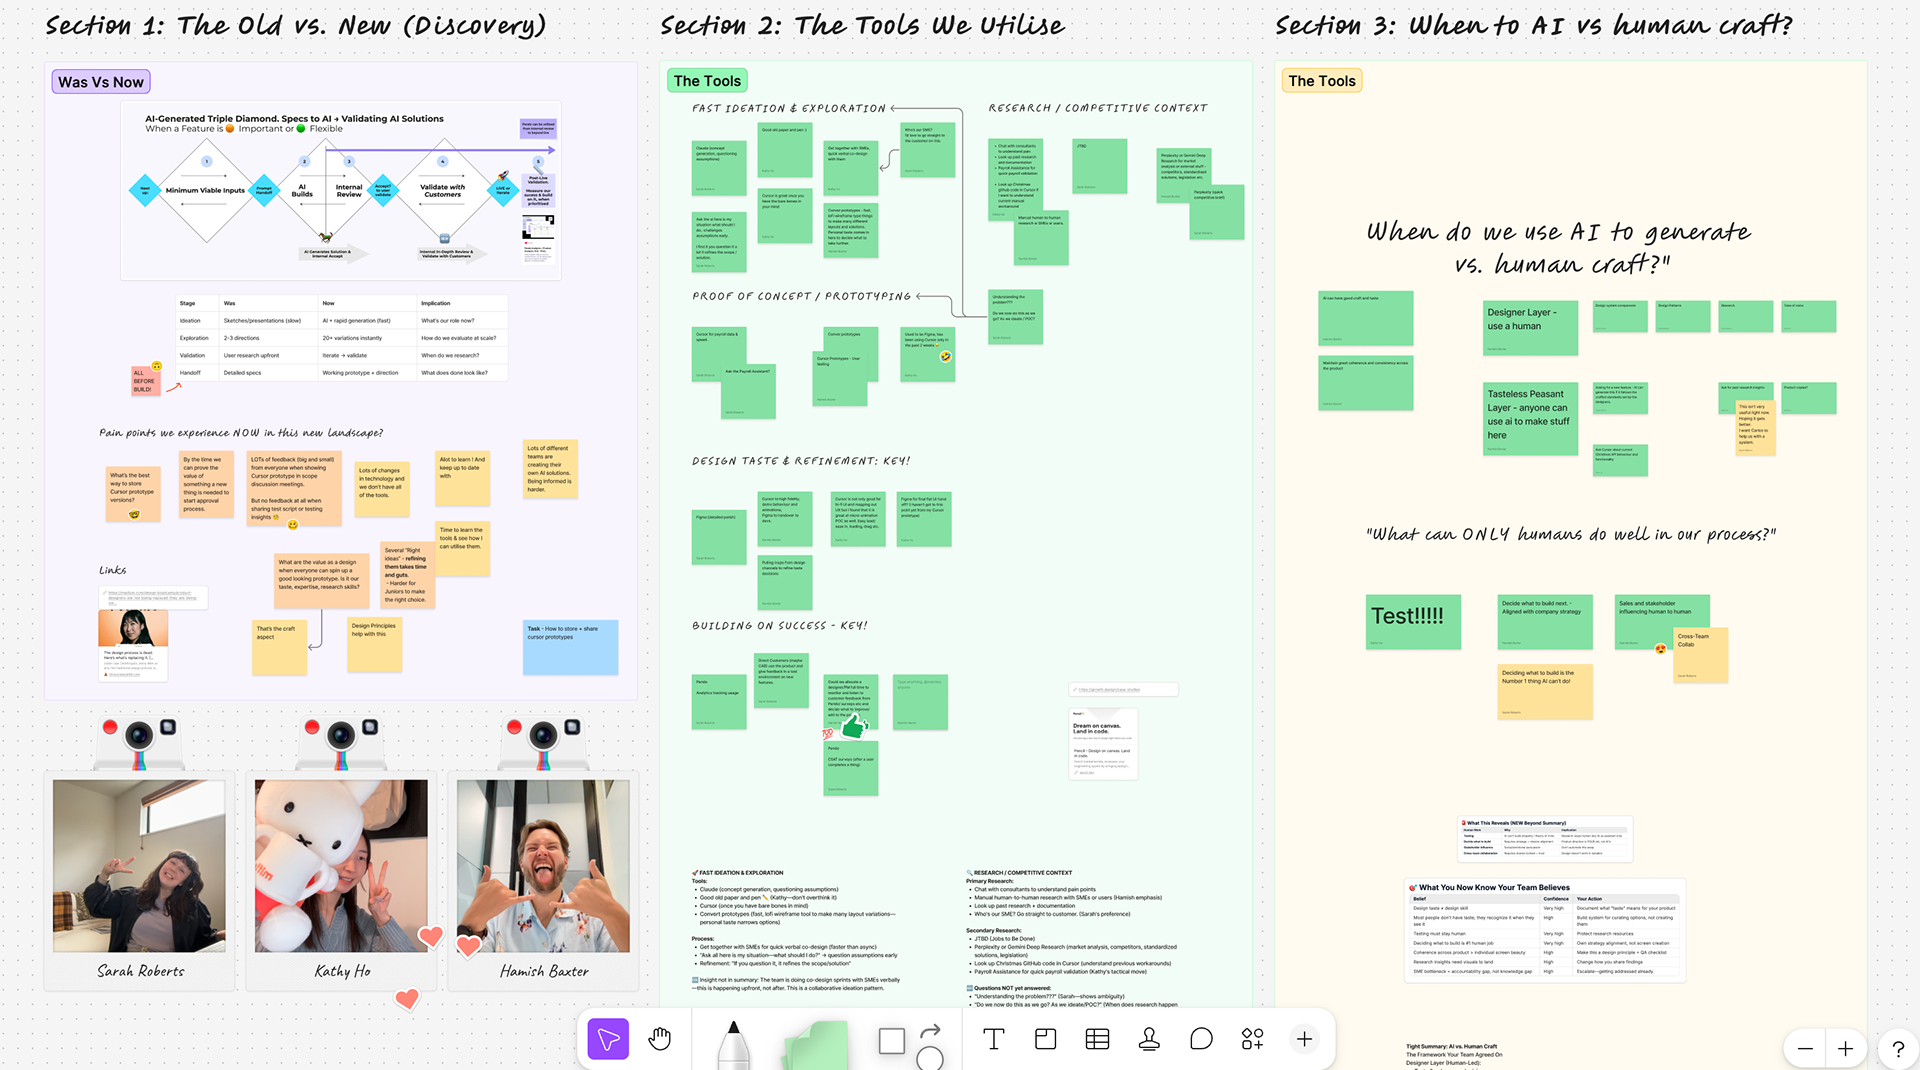
New model when simple: Feature spec (no design)→ build with AI Design System → validate code → live.
New model when complex: Iterate rapidly with AI → validate with customers → build with confidence.
Exploration: From limited directions to broad, assumption‑driven variation
Validation: From late-stage testing to continuous iterate‑and‑learn
Research: Guides and sharpens exploration rather than gating it
Handoff: Prototypes and clear direction instead of abstract specs
A validated problem framing
An evidence-backed direction
Key risks surfaced and reduced
Reusable patterns fed back into the system
Depending on solution complexity and risk (if high complexity and a new ODI piece), we action all of the above before engineering builds anything. We de-risk with speed, not more planning. If the solution is low complexity & risk, we let our new AI Design System create solutions, and we quickly validate at the end.
I redesigned our discovery operating model for an AI‑first environment — going beyond tools to change how teams explore, decide, and validate. I focus where human judgment matters most: problem framing, decision clarity, and determining the right moment to validate with customers.
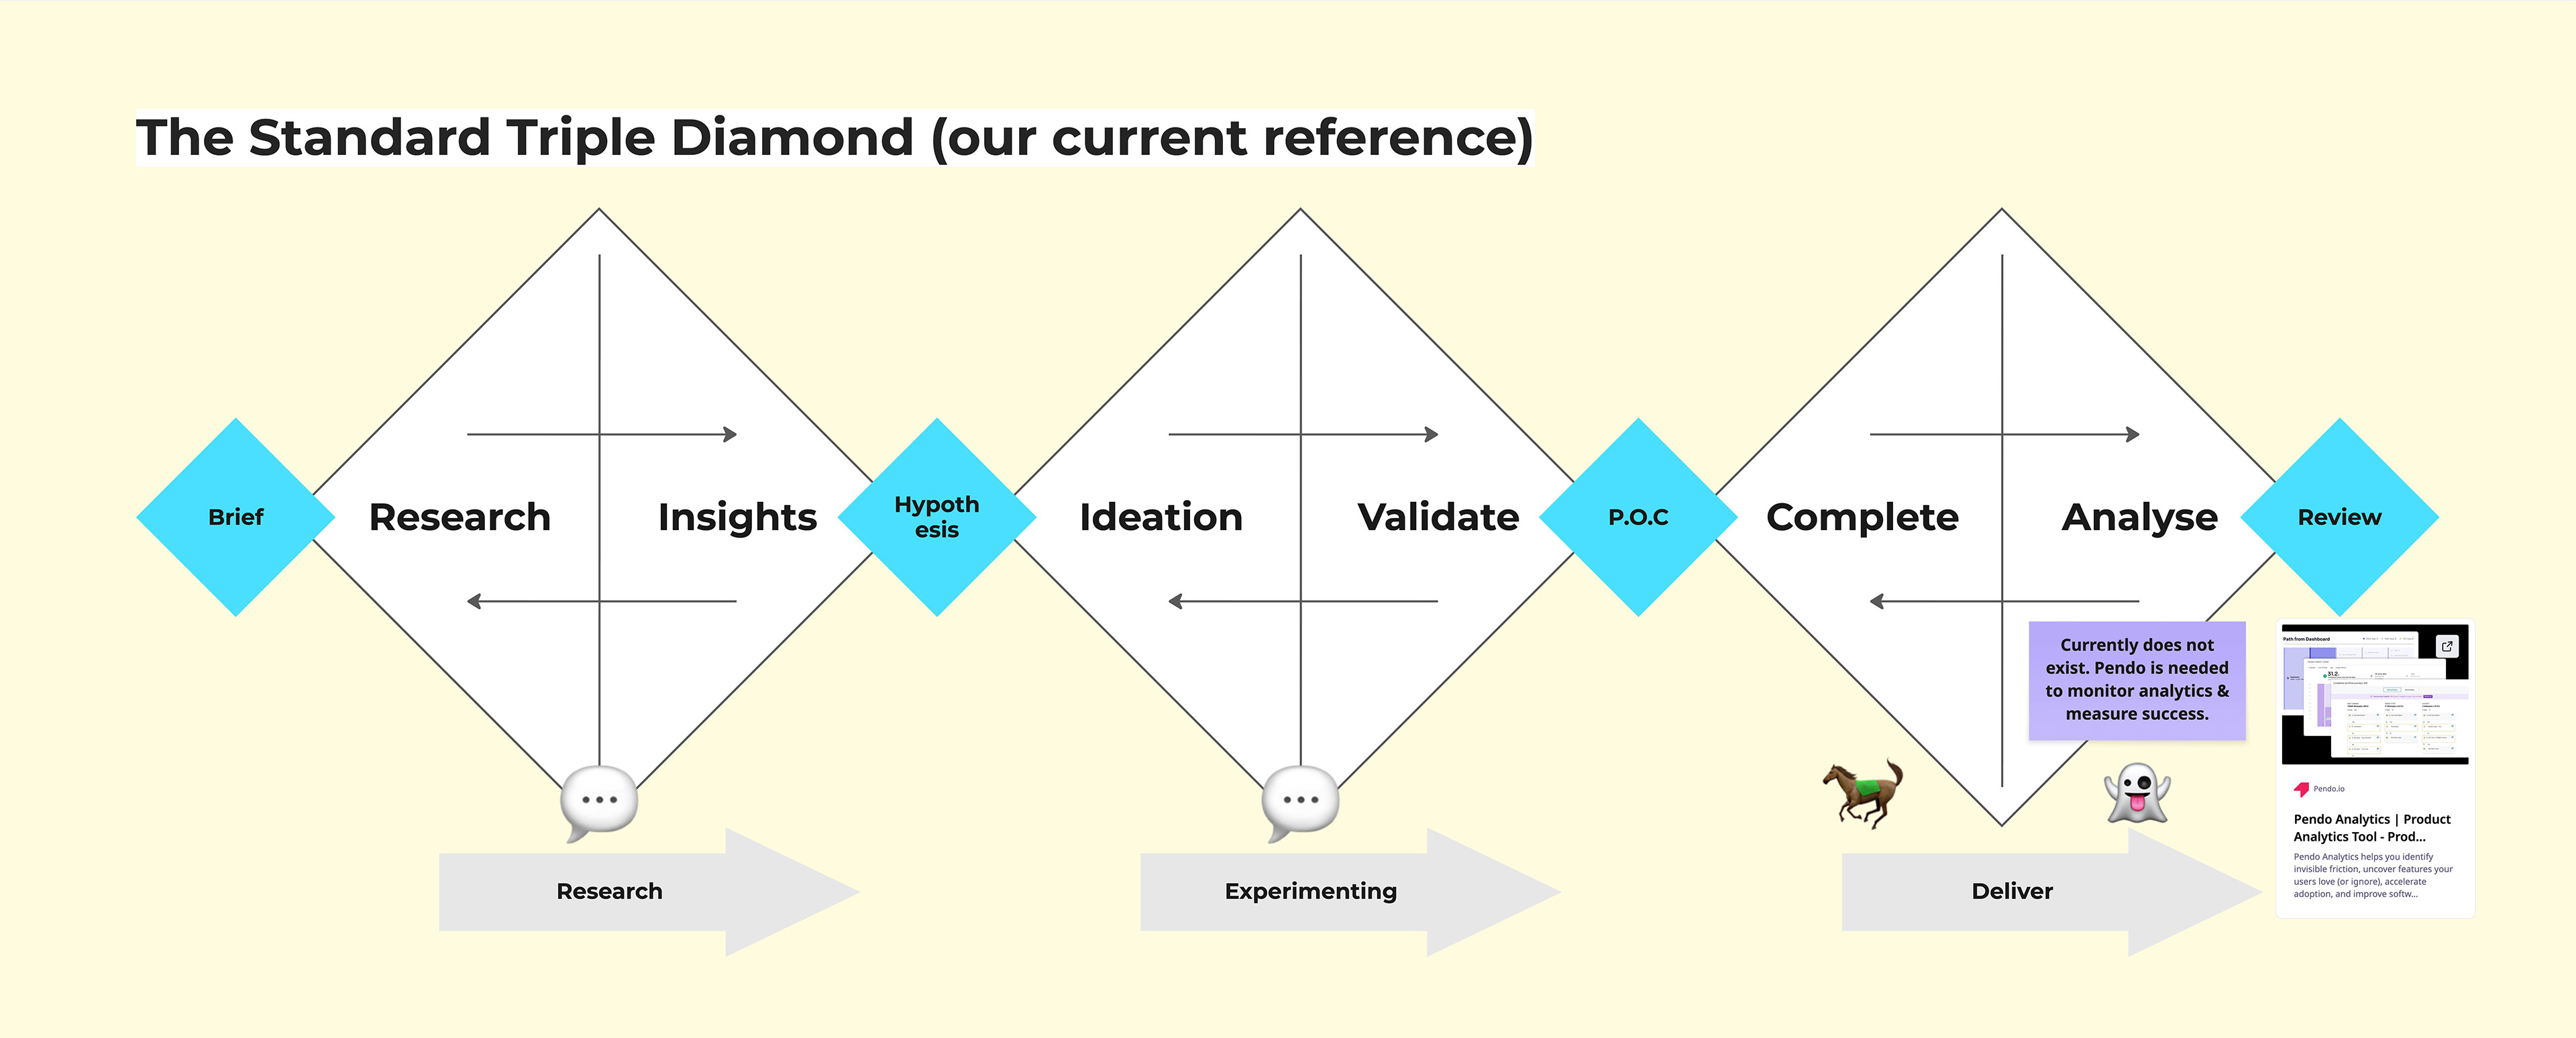
BEFORE: Traditional Discovery when I arrived at Datapay
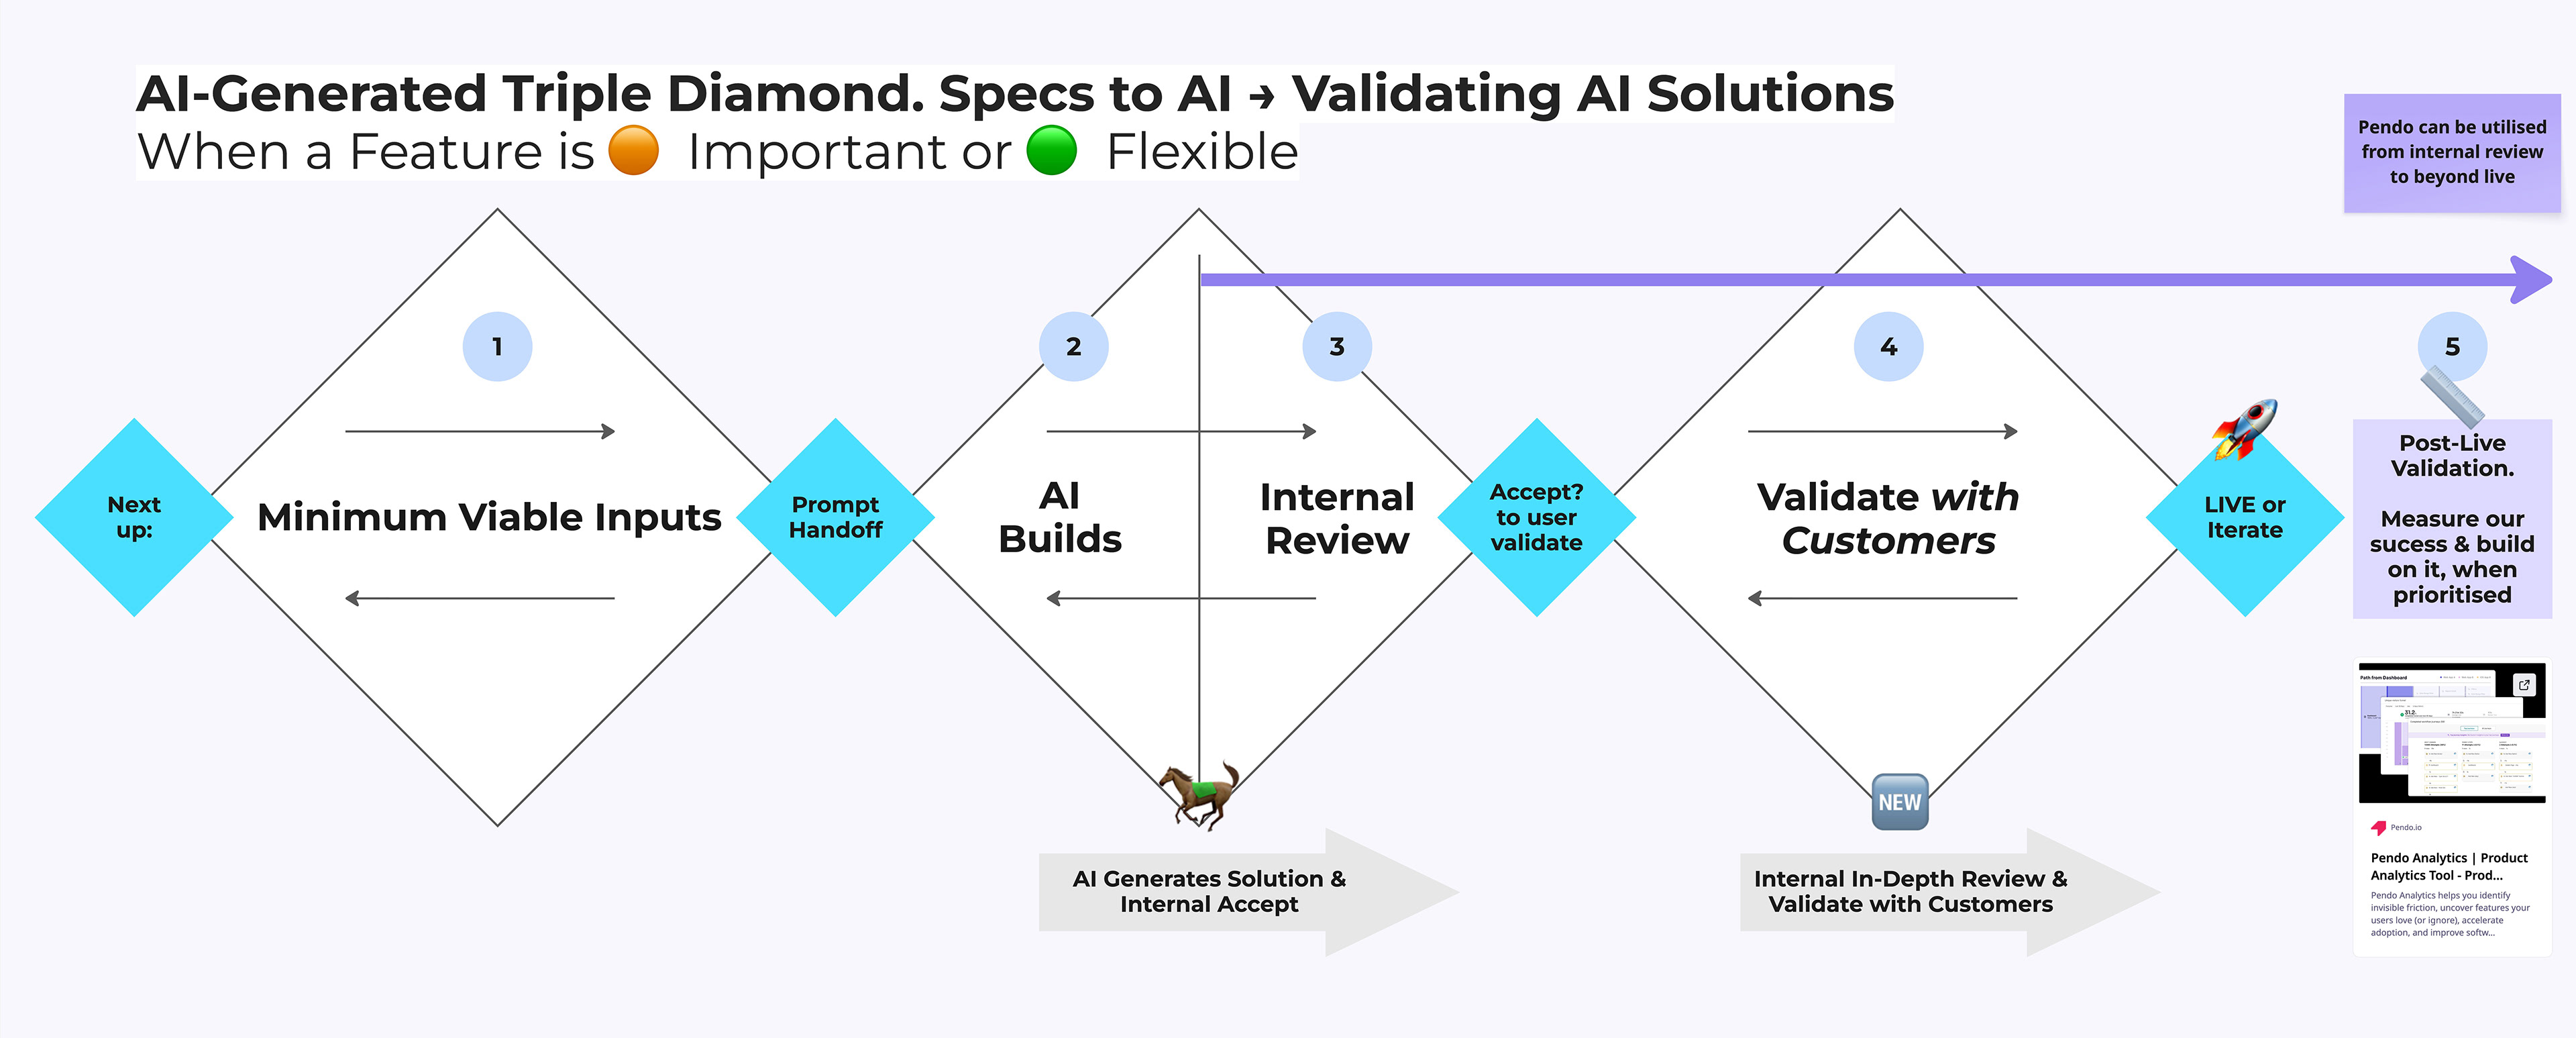
AFTER: Outcome Driven Innovation Discovery when the AI Design System can't handle the complex/new feature
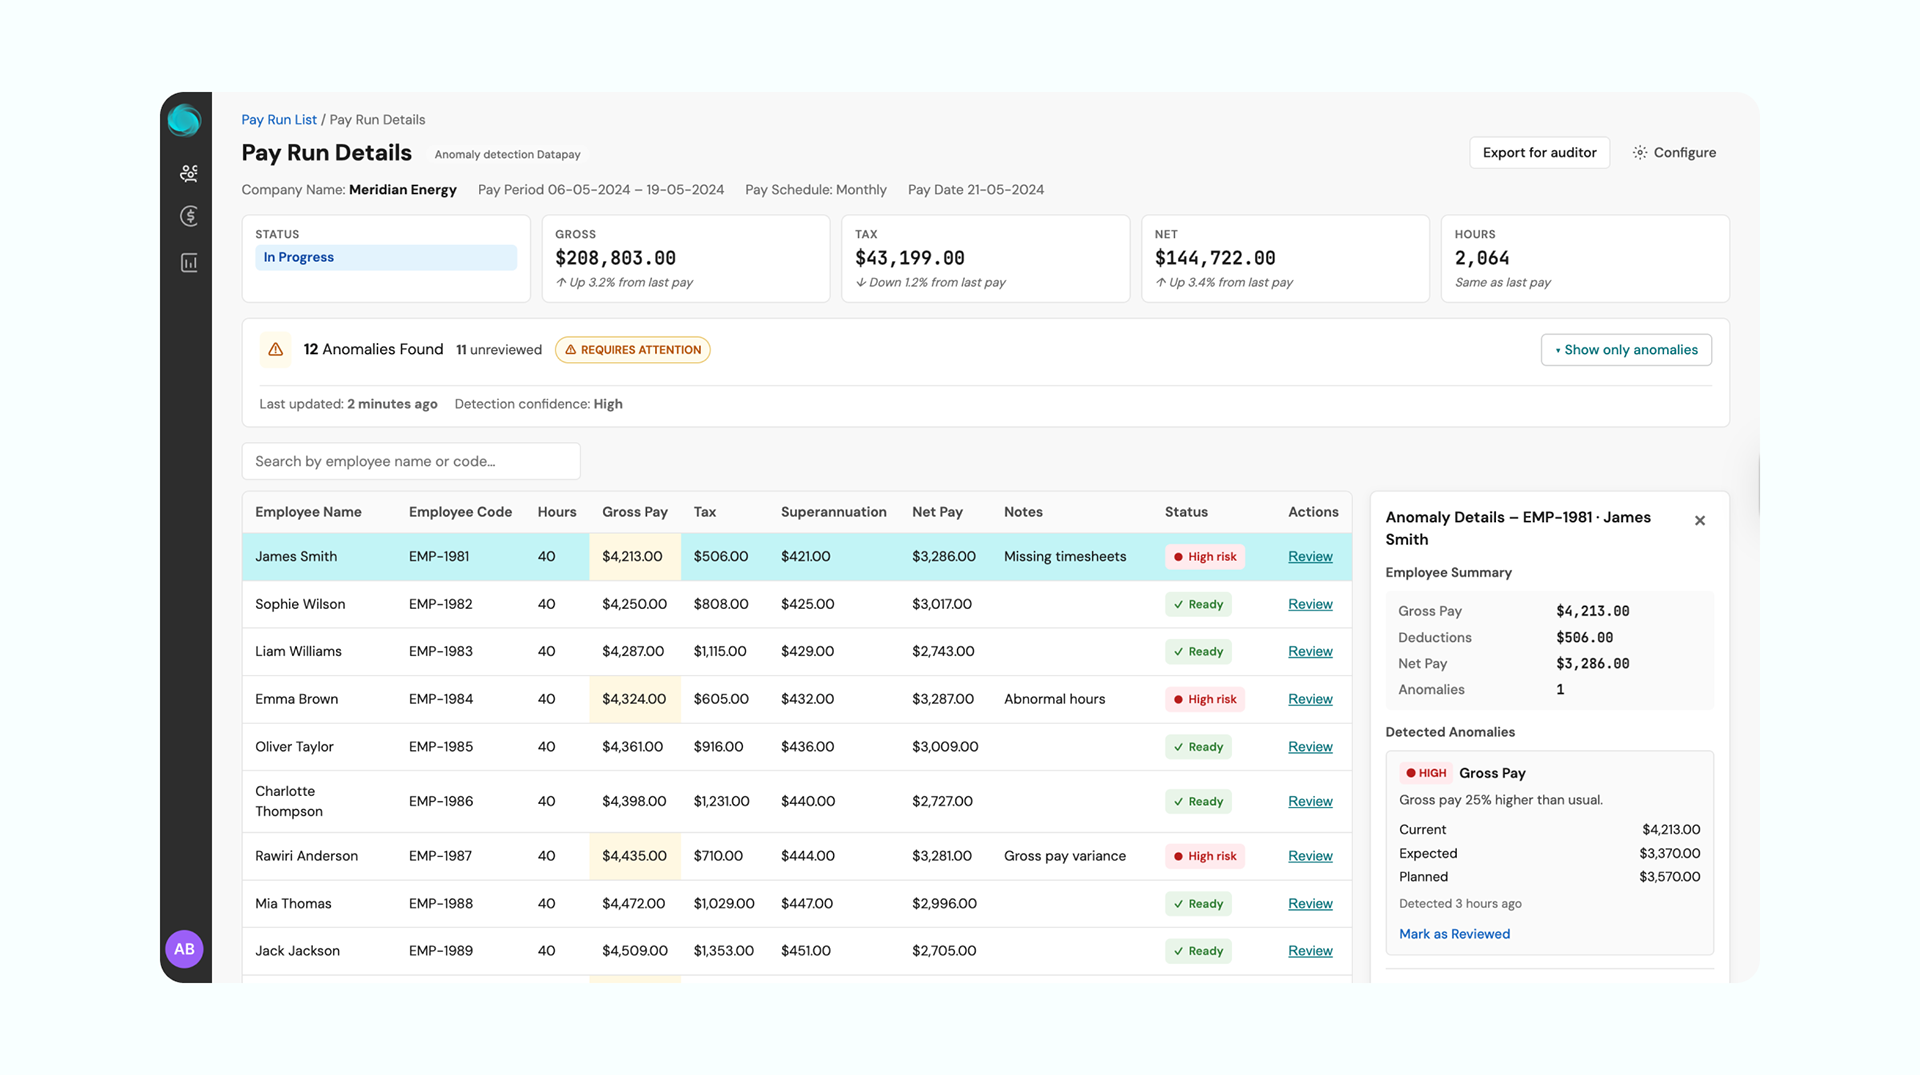
For the anomaly detection opportunity, we explored multiple solution directions with customers using real payroll scenarios. The focus was on testing assumptions early:
• Different UX patterns for surfacing anomalies
• Trust signals (explain-why, variance views, tolerance bands)
• Automation boundaries (when agents act vs. suggest)
• Explainability and safe reversal standards
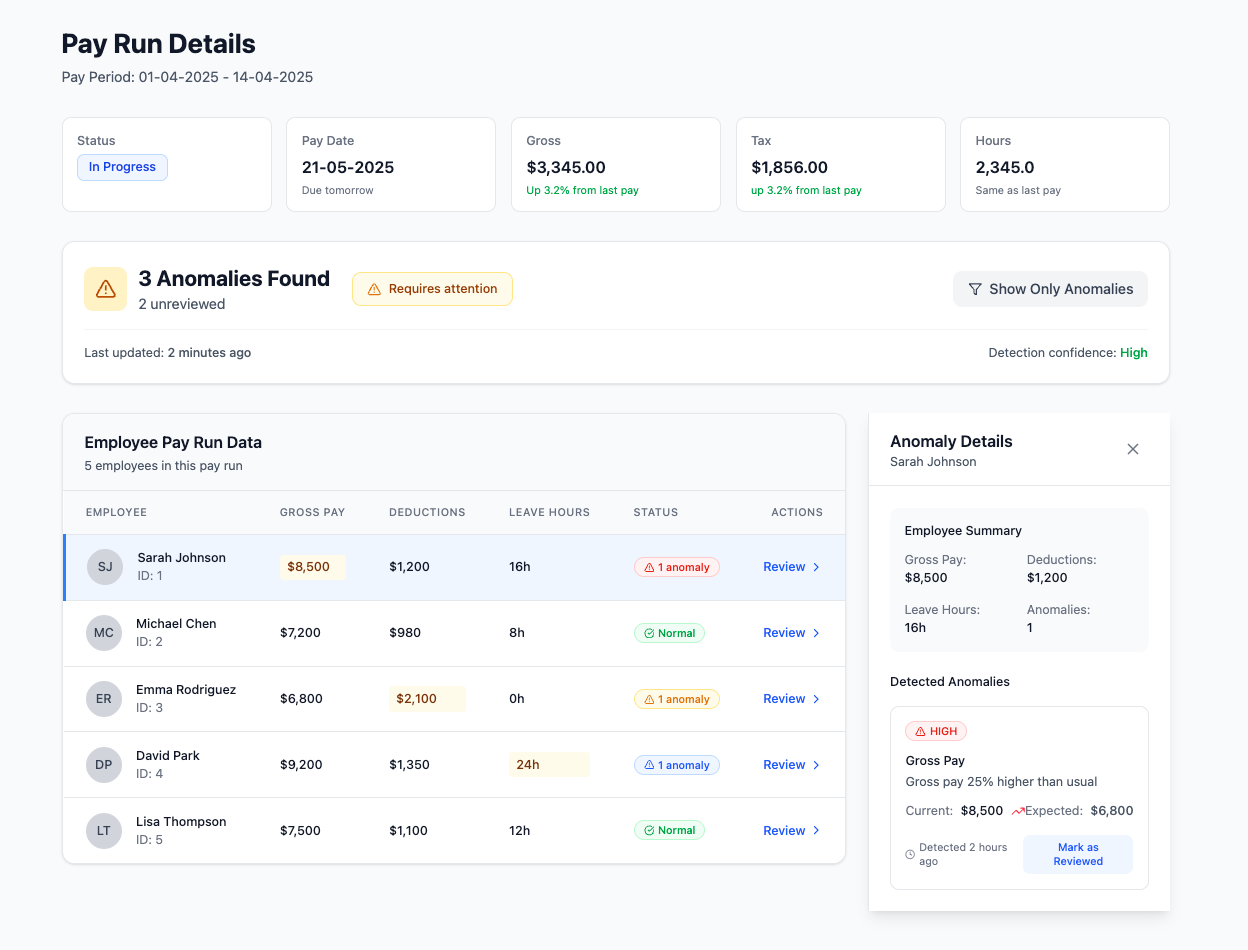
Reporting was the highest pain uncovered in the previous CAB session. From here, we interviewed 10 customers with exploratory questions, then created 4 concepts from our synthesis insights. This is concept 1: anomaly detection.
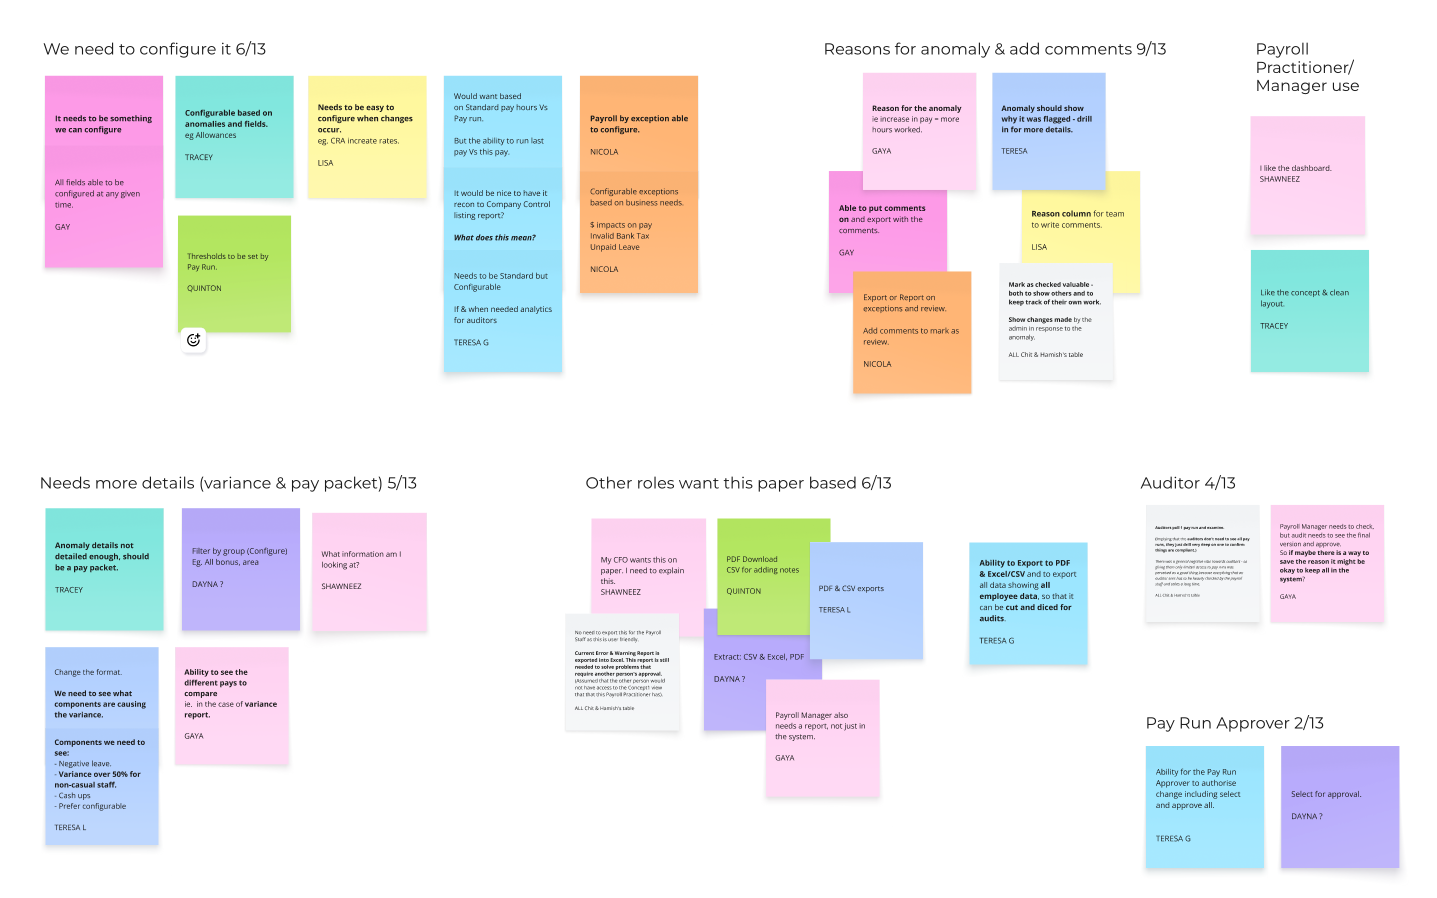
Concept 1 feedback. We gathered a value vote for all and ensured each participant wrote their name on their stickies so we could hypothesise why certain feedback was given depending on their role abd companies needs.
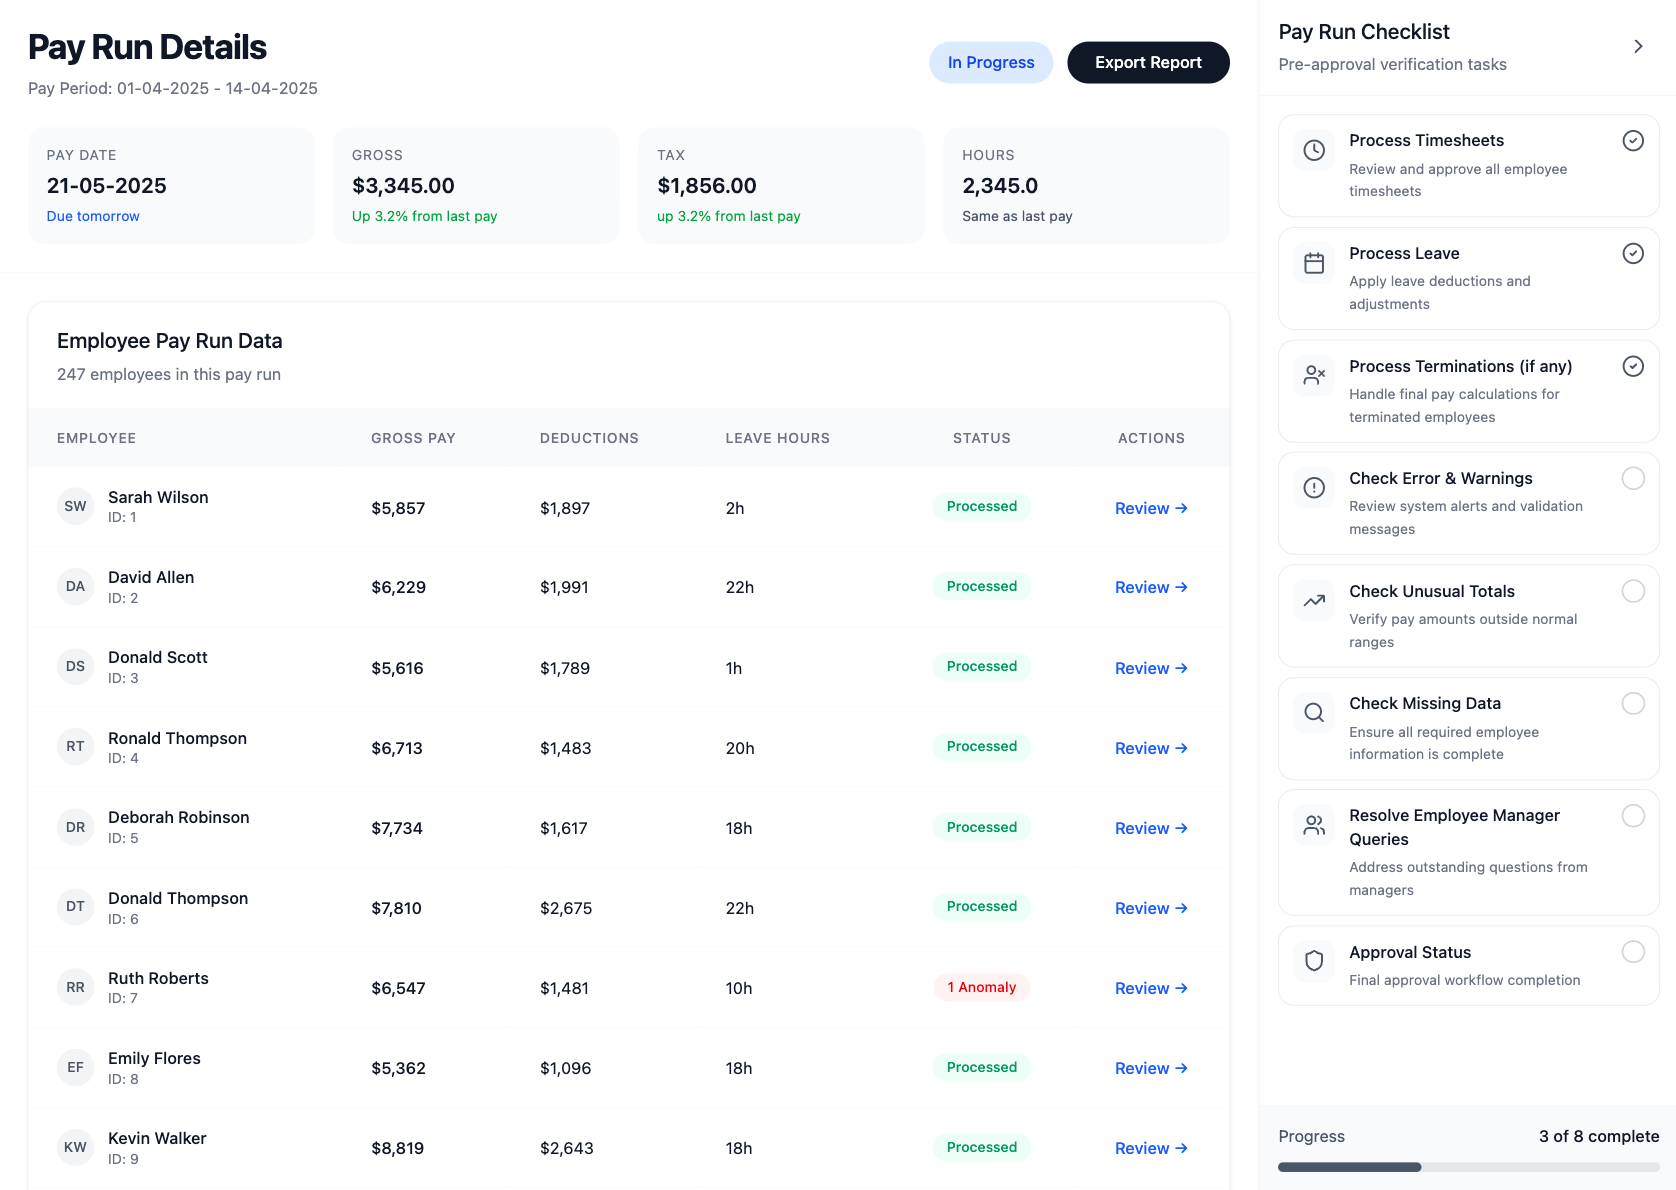
Concept 2: Payrun Checklist
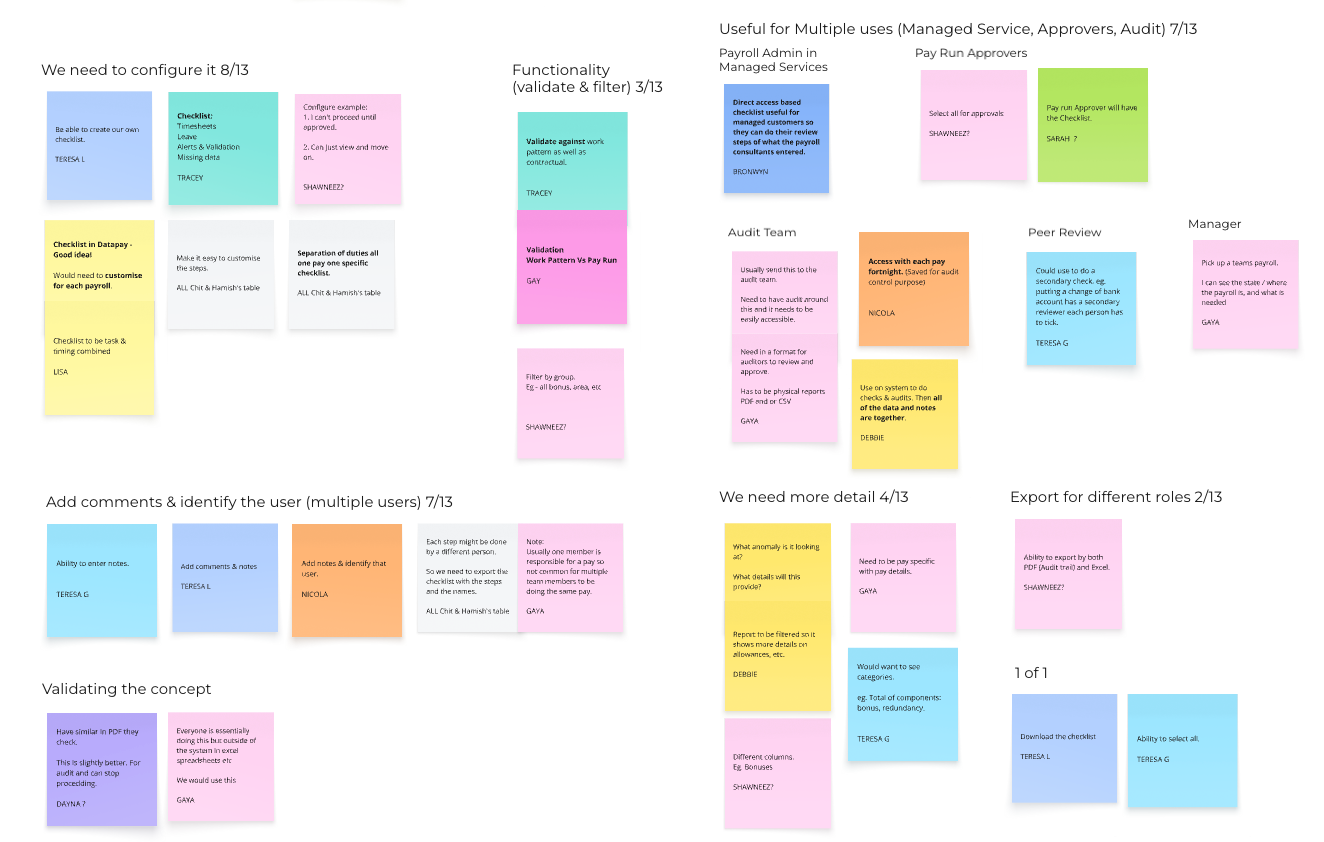
Concept 2: Feedback
Several themes were consistent across roles and experience levels:
• Configurability matters – experienced payroll professionals want systems that learn from them and support less experienced team members.
• Transparency builds trust – showing the logic matters as much as the output.
• Reversibility is essential – AI recommendations must be safe and easy to override.
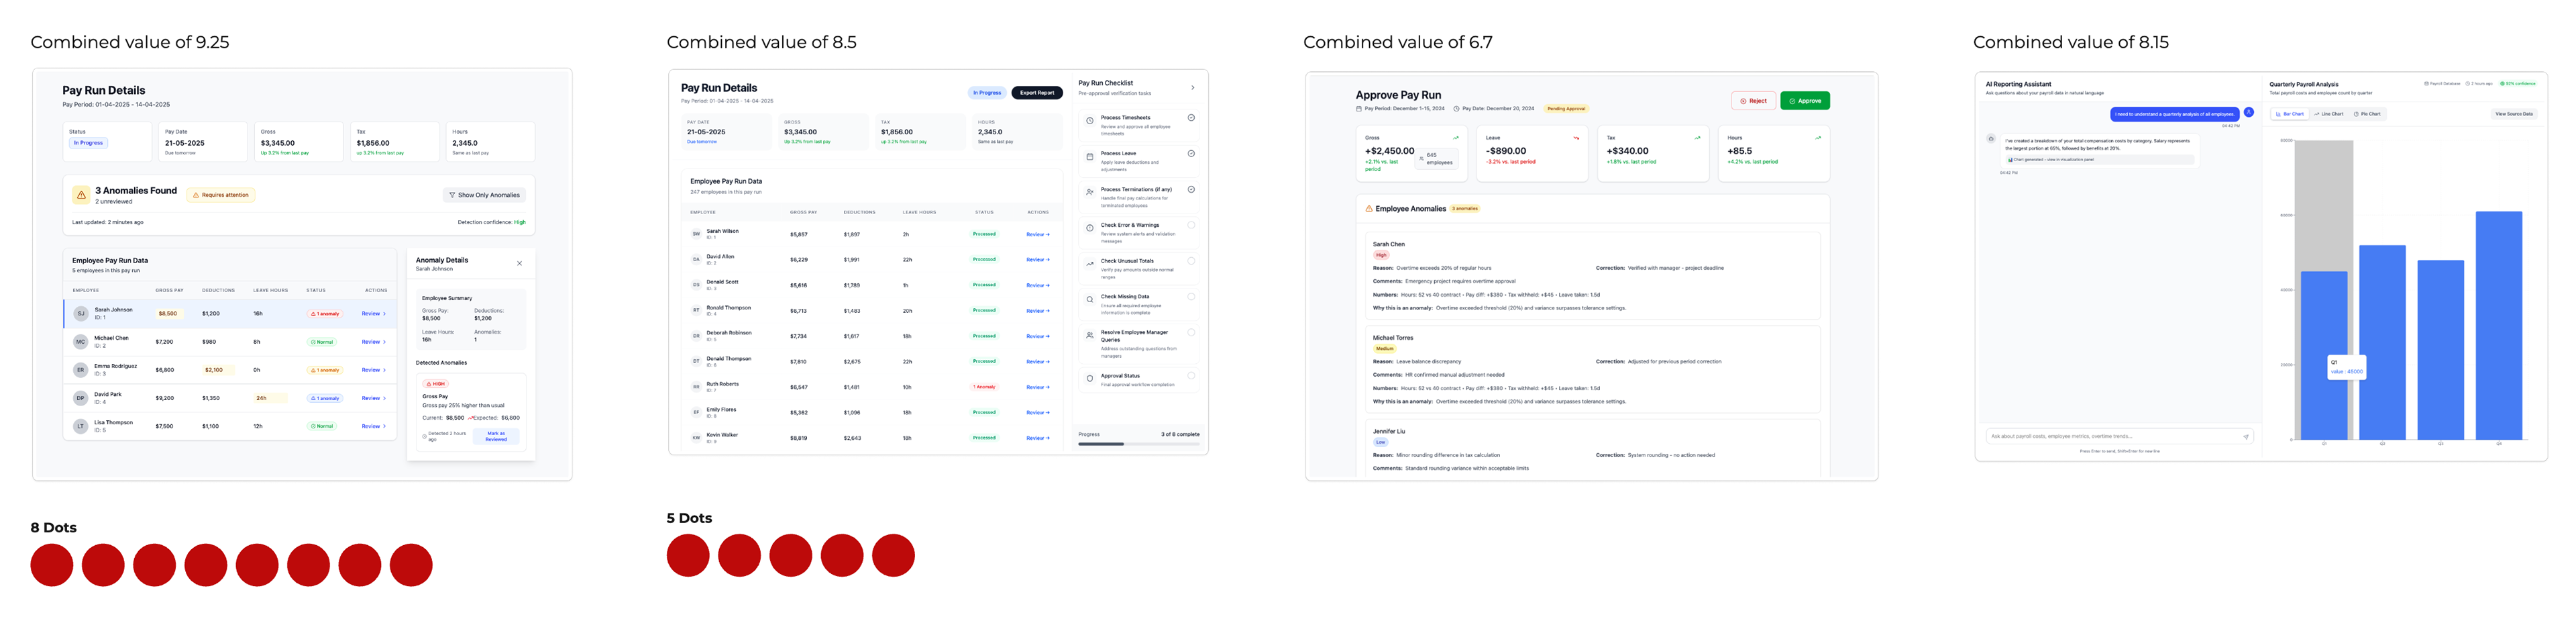
CAB prioritisation and voting outcome
After reviewing all four concepts in the session, participants placed:
• 8 dots on Concept 1: Anomaly Detection
• 5 dots on Concept 2: Centralised Checklist
• No dots on Concepts 3 or 4
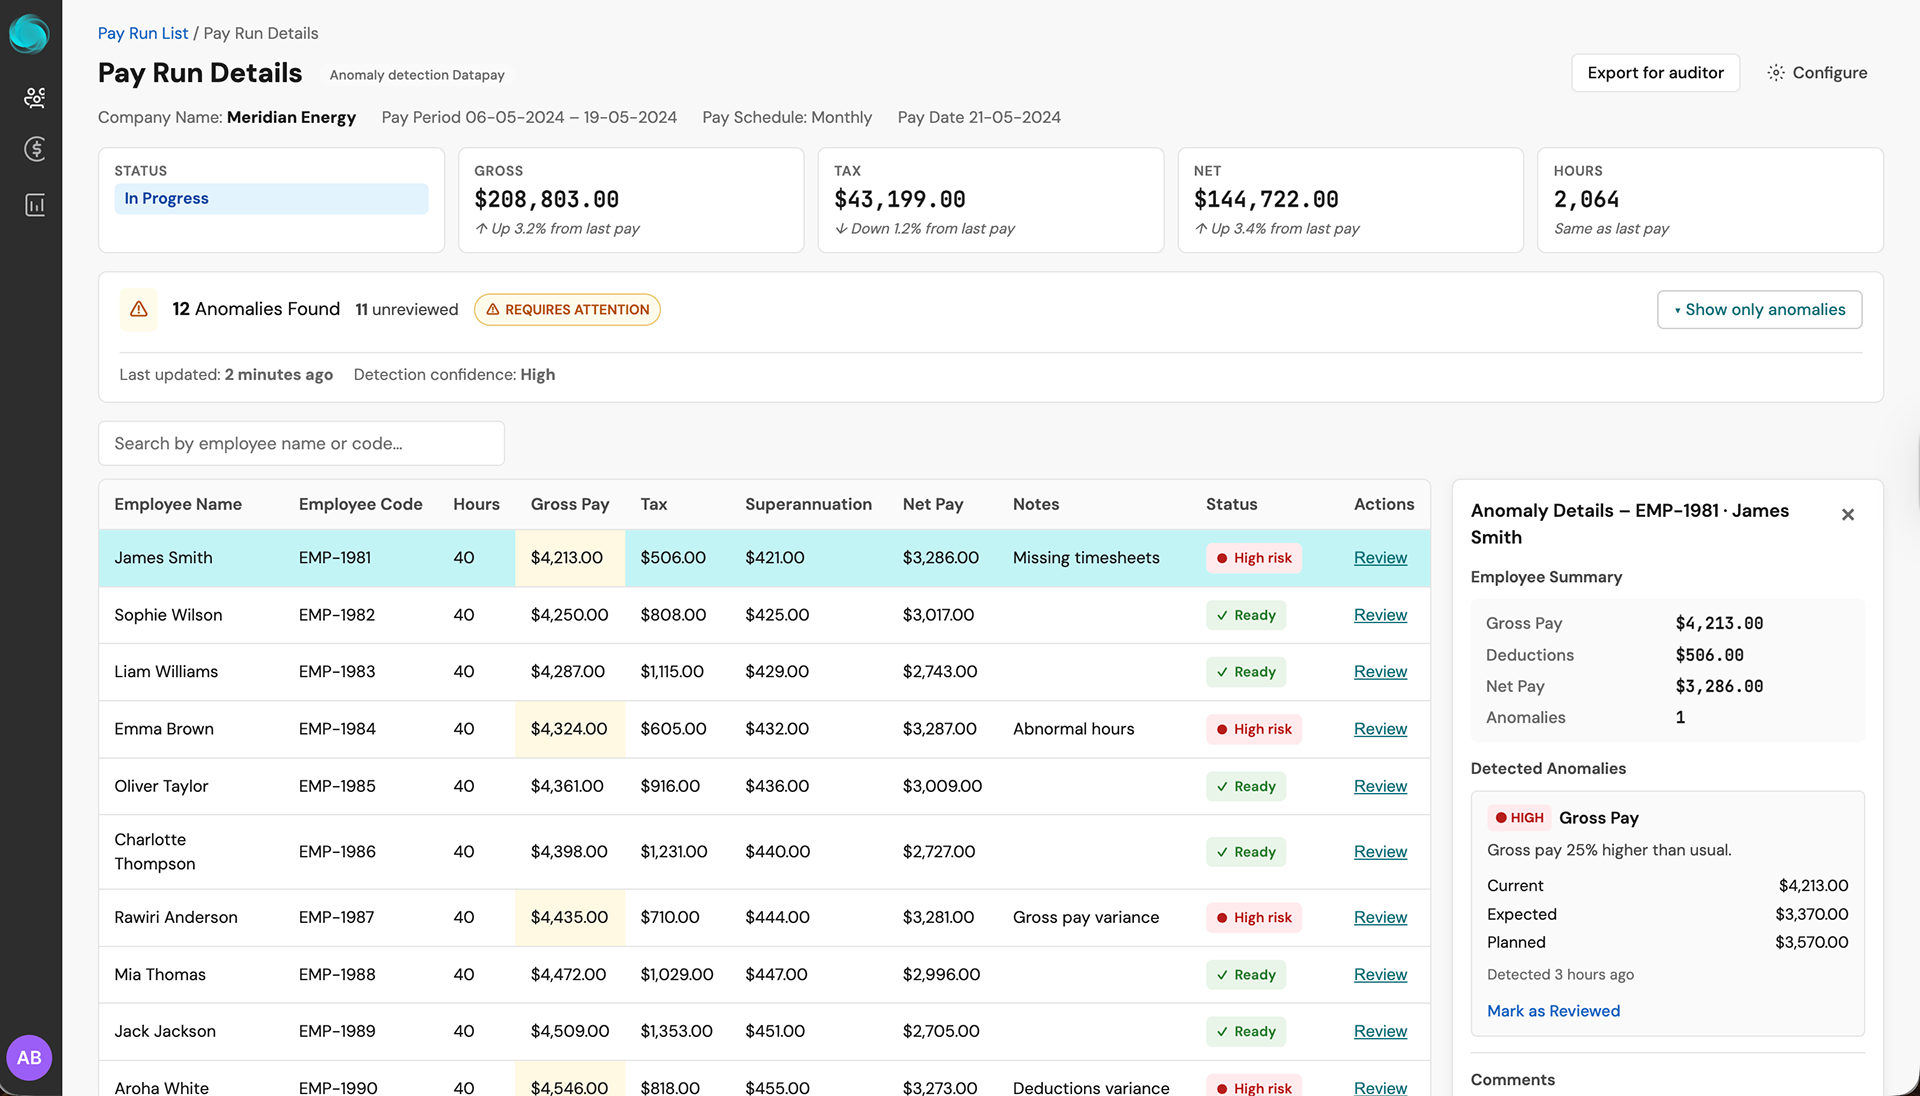
After CAB we created a final prototype based on our detailed feedback, ready to build and test in live code.
• Spend more time with the anxious designer, sharing industry insights regularly.
• Explain that we control what design's value is – it's about judgment, craft, framing, and velocity, not just execution.
• Model using AI tools openly (Cursor, Claude, Loveable)
• Sharing my own uncertainty and learning curve, rather than presenting false confidence
AI doesn't replace designers who can think strategically – it sorts them. Designers who can frame problems, validate with customers, and move fast with AI are more valuable than ever.
Leading the Design Team through change. Regular team discussions mapping what changes with AI and what remains human‑led.
↑ Stakeholder alignment, across Product, Design, and Engineering, on what matters and why.
↑ Increased design capability, with designers independently using AI tools.
• Clearer roadmap decisions, with fewer reversals and less cross‑team debate
• Planning conversations now references jobs and outcomes, not features.
• Stakeholders proactively involve research in customer conversations.
• CAB feedback has shifted from “add this feature” to “this solves my real problem”.
We’ll track time‑to‑confidence, exception resolution rates, explainability completeness, and cost‑to‑serve reduction.
Leading with jobs reduces opinion‑based debate and aligns teams around outcomes.
Scored outcomes made prioritisation clearer and de‑risked where we invested in agentic AI.
Designers who can frame problems, validate with customers, and move fast with AI are more valuable than ever.
Agentic systems only work when users understand why something is happening.
Sharing insights, showing momentum, and making customer needs tangible is how design earns influence.
I modelled uncertainty, learning, and tool adoption so the team could build confidence through change.